![]()
![]()
![]()
Use LEFT and RIGHT arrow keys to navigate between flashcards;
Use UP and DOWN arrow keys to flip the card;
H to show hint;
A reads text to speech;
27 Cards in this Set
- Front
- Back
|
Measures of Central Tendency
Define Mode, Median, an Mean
|
Mode = The most commonly occurring score
Median =Represents the 50% in a ranked distribution of scores; that is, that point at which 50% of the numbers fall above and below.
Mean = computed by summing the values of each observation and dividing by the number of observations |
|
|
15, 2, 23, 7, 18, 13 , 9, 23, 8, 16, 27, 28, 4, 12, 24, 12, 18, 18, 14, 6, 15, 15, 31, 15, 15
1) What is the mode, median, mean? |
Mode 15
Median 15
Mean 15.68 |
|
|
15, 2, 23, 7, 18, 13 , 9, 23, 8, 16, 27, 28, 4, 12, 24, 12, 18, 18, 14, 6, 15, 15, 31, 15, 15
What measure of central tendency would be the best estimate of this data and why? |
Mean - because there are no outliers. |
|
|
1) What is the range? 29
2) What is the hinge?
|
1) 29
2) the median of the high and low portions of a data set
3) 12, 18 |
|
|
. 1) What is the midrange?
2) What is the low range?
|
1) 16.5
2) 13
3) 16 |
|
|
Provide definitions/explanation for the following terms:
1a) null and 1b) alternative hypothesis, 2) significance level,
3) directional hypotheses, |
1a) hypothesis being tested (1b) the accepted hypothesis if the null hypothesis is rejected
2) probability of a false rejection of the null hypothesis / Type I Error
3) hypothesis that specifies whether the prediction will have "+" or "-" correlation
|
|
|
Provide definitions/explanation for the following terms:
1) non-directional hypotheses,,
2) one-tailed and two-tailed tests,
3) Two tailed test |
1) hypothesis used to prove (or disprove) that changing one variable has an effect on another variable
2) A test based on a directional H1, in which critical values are obtained for only 1 tail of a distribution
3) A test based on a nondirectional H1, in which critical values represent both positive and negative tails of a distribution |
|
|
Provide definitions/explanation for the following terms:
1) significant testing,
2) Critical Value (alpha),
3) reject the null, |
1) testing to derive if there is a significance between two groups of data
2) point in the data set which is considered significant when reached
3) accepting the alternative hypothesis (happens when critical value of a data set is reached or surpassed |
|
|
Provide definition/explanation for the following term
1) retain the null
2) p-value
3) calculated value, |
1) critical value not reached; acceptance of the null
2) probability that a number will be selected at random
3) number derived from computational procedures |
|
|
A psychologist has been studying the effects of deterioration of memory over time. She has been interested in how memory for particular startling events, called flashbulb memories, might differ from memory for everyday events. She asked college students to try to remember all the circumstances of an ordinary event to fill out a survey about the details of the event. She knew from vast amounts of prior research that the average proportion of details accurately remembered 1 year later is .85 with a standard deviation of .04. When the Persian Gulf War began in January 1991, she asked students to do the same task of filling out the survey about the details of the beginning of the bombing. She thought that the proportion of details remember 1 year later would be higher. The following are the proportions correct for 22 students: .81 .65 .93 .78 .79 .87 .86 .83 .87 .85 .77 .86 .80 .81 .82 .83 .87 .85 .85 .84 .83 .90 |
A psychologist has been studying the effects of deterioration of memory over time. She has been interested in how memory for particular startling events, called flashbulb memories, might differ from memory for everyday events. She asked college students to try to remember all the circumstances of an ordinary event to fill out a survey about the details of the event. She knew from vast amounts of prior research that the average proportion of details accurately remembered 1 year later is .85 with a standard deviation of .04. When the Persian Gulf War began in January 1991, she asked students to do the same task of filling out the survey about the details of the beginning of the bombing. She thought that the proportion of details remember 1 year later would be higher. The following are the proportions correct for 22 students: .81 .65 .93 .78 .79 .87 .86 .83 .87 .85 .77 .86 .80 .81 .82 .83 .87 .85 .85 .84 .83 .90 |
|
|
a. What is the IV?
d. What is the alternative hypothesis?
|
a. Memory Event
b. What the students remember
c. Ho: µ = x
d. H1: µ ≠ x
e. If traumatic events has a significant change in memory retention. |
|
|
f. Is this a directional or nondirectional hypothesis, and is it going to be tested using a one or two tailed test?
|
f. nondirectional, two tailed
g. p= 0.1135, t= 1.6517 |
|
|
h. Using alpha at .05 (95% confidence), draw conclusion – which means deciding whether to reject the null or retain the null. Please draw this out (using a bevel shaped curve)
|
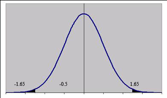
<1.65 retain null region
≥1.65 reject null region
|
|
|
i. If you had to explain the results to a friend who does know statistics, what would you say? |
There aren’t any significant factors relating to traumatic and non traumatic events contributing to memory retention |
|
|
What type of error did we probably make in the question above, type I or type II??? To answer this review the section about power. |
Type II (False negative) |
|
|
Give ways to increase power. What variables influence power? |
change the alpha level (a 0.15 α will make p < α; this will reject the null) |
|
|
Define:
a) Independent t-test: aka ___????_____,
*** t-test measures what kind of data?
c) Descriptive statistics:
|
a) aka unpaired t-test- testing two variables using two different samples
b) aka paired t-test- testing two variables using the same sample
*** t-tests measures ratio and interval data
c) Using measures of central tendency of mean, mode, and median to measure data
|
|
|
Define:
e) ANOVA: |
d) measures nominal and ordinal data
e) used to measure three or more levels of IV |
|
|
Be able to identify the IV , DV, and choose the appropriate statistical test for each study from the list below. |
Be able to identify the IV , DV, and choose the appropriate statistical test for each study from the list below. |
|
|
1. The researcher wanted to know if individuals in different relationship stages: single, casual dating, serious dating and married would differ on their relationship satisfaction and trust.
|
1.
IV: relationship stage |
|
|
2. A research wants to know the difference between males and females on their level of verbal aggression (verbal aggression (VA) is measure by Infante’s 20 item Likert-type scale)
|
2.
IV: gender |
|
|
3. A group of students were asked to watch a violent TV show. Students were asked to fill out the measure of verbal aggression (VA) to assess their levels of VA prior to watching the TV show and then again after watching the TV show. Researchers want to determine if there is a difference between these students’ VA before and after the TV show.
|
3.
IV: TV show |
|
|
4. Males and females were also asked to rate their preference of 10 TV shows from like the most to like the least. Then researchers want to know if men and women differed on their preference of TV shows.
|
4,
IV: Males and Females |
|
|
5. Females were asked to indicate what type of movie they preferred: Horror, Romance, Comedy, or Action. Researchers wanted to know if females significantly differ on their preference of movies.
|
5.
IV: Females |
|
|
6. Researchers wanted to know if certain age groups preferred certain movies. Therefore, researchers asked participants their age – 0-12 = children; 13-24 adolescence; 25-36; younger adults; and then asked them which movie they preferred: Horror, Romance, Comedy, or Action (the researcher coded children as 3, adolescence as 2 and younger adults as 1).
|
6.
IV: Age groups |
|
|
7. Researchers then took these three age groups (in question 6) and randomly assigned them to two groups – horror film and a non-horror film. Then subjects were asked to give their opinions/attitude on the movie (like-dislike). The researchers wanted to see if attitudes towards horror films would differ depending on subjects’ age and what type of movie they viewed. |
7.
IV: age is quasi IV 3x2 Factorial Children / Adolescence / Yng Adlt |
|
|
8. Finally, researchers wanted to determine whether or not the medium of a story (the way in which it is presented to a person) would influence their attitude towards the story. Therefore, researchers randomly assigned subjects into three groups: Group one – read the book “Tuesdays with Morrie.”
Then, each group was asked to fill out a 20 item semantic-differential scale to assess their |
8.
IV: medium |