![]()
![]()
![]()
Use LEFT and RIGHT arrow keys to navigate between flashcards;
Use UP and DOWN arrow keys to flip the card;
H to show hint;
A reads text to speech;
67 Cards in this Set
- Front
- Back
|
descriptive stats |
summarizes a group of scores (mean, range, etc.) |
|
|
inferential stats |
draw conclusions about something (t-test, correlations) |
|
|
population |
all possible observations (US citizens, MSU students) |
|
|
sample |
a set of observations from a population (300 MSU students) |
|
|
parameter |
statistical info about a population |
|
|
statistic |
information about a sample |
|
|
2 variable types |
discrete and continuous |
|
|
discrete |
-nominal and ordinal |
|
|
continuous |
scale variables -interval and ratio |
|
|
nominal |
qualitative - implies no rank/distance - EX. eye color, ID# |
|
|
ordinal |
qualitative or quantitative - rank order but can not tell distance between - EX. getting 1st, 2nd, 3rd in a race w/o times |
|
|
interval |
quantitative - rank order and distance between ranks |
|
|
ratio |
quantitative - rank order, distance between ranks, and has a discrete zero point |
|
|
independent variable (IV) |
variable we manipulate |
|
|
dependent variable (DV) |
variable observed for chance bc of IV |
|
|
confound |
any variable that could be cause the effect other than the IV |
|
|
reliability |
consistency |
|
|
valitidy |
measurement accuracy |
|
|
hypothesis testing |
drawing conclusions about whether a relationship is supported by evidence |
|
|
operational definition |
procedures used to measure/manipulate variables |
|
|
within-groups |
all participants experience each level of the IV |
|
|
between-groups |
each participant experiences only one level of the IV |
|
|
describing distributions |
modality - kurtosis - skewness - description(describe the mean, mode, range) |
|
|
unimodal |
1 peak - like normal curve |
|
|
bimodal |
2 peaks |
|
|
multimodal |
3+ peaks |
|
|
positive skew |
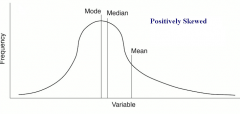
tail is pulled to the positive side (right) |
|
|
negative skew |
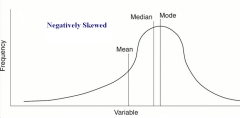
tail is pulled to the negative side (left) |
|
|
kurtosis |
leptokurtic - platykurtic - mesokurtic |
|
|
leptukurtic |
peaked "thin/pointy" distribution |
|
|
platykurtic |
flat "plateau-like" distribution |
|
|
mesokurtic |
normal curve - neither leptokurtic nor platykurtic |
|
|
central tendency |
descriptive statistics that best represent the center of a data set |
|
|
symmetrical normal distribution |
mean = median = mode |
|
|
positively skewed distribution |
mean > median > mode |
|
|
negatively skewed distribution |
mean < median < mode |
|
|
variability |
how spread out the data is |
|
|
deviation scores |
D - the amount a score differs from the mean |
|
|
sum of squares |
SS - solves the summing deviation scores issue
SS= ∑(x-M)^2 |
|
|
average |
s^2 - usual squared distance from the mean |
|
|
variance of a sample |
s^2= ∑(x-M)^2 -------------- N-1
|
|
|
variance of a population |
σ^2= ∑(x-M)^2 -------------- N |
|
|
standard deviation of a sample |
s= √∑(x-M)^2 ---------------- N-1 |
|
|
standard deviation of a population |
σ= √∑(x-M)^2 ---------------- N |
|
|
random sampling |
a note on random |
|
|
convenience sampling |
using readily available participants EX. most universities use this |
|
|
volunteer sample |
a type of convenience sampling - aka "self-selected" sample - can be very biased |
|
|
confirmation bias |
pay attention to information that confirms our initial beliefs |
|
|
illusory correlation |
believing an association exists when it does not |
|
|
personal probability |
our own belief of the likelihood an event will occur - not how we think of it in statistics |
|
|
probability definition |
the actual likelihood an outcome will occur out of all outcomes success probability = ----------------- trials |
|
|
percentage |
100x a proportion |
|
|
proportion |
a proportion - always ranges from .00 to 1.00 |
|
|
independent trials |
getting a result cannot effect the outcome of previous trials |
|
|
hypothesis |
a statement that there is a difference between populations or sometimes, more specifically, that there is a difference in a certain direction - a guess as to what you think might be true |
|
|
research question |
an observation, idea, or inquiry about a specific concern or issue |
|
|
research hypothesis (H0 / H1) |
always think in terms of null - we only "reject" or "fail to reject" the null |
|
|
the null hypotheses (H0) |
there is no relationship between the IV and DV |
|
|
the alternative hypothesis (H1) |
there IS a relationship between the IV and DV |
|
|
non-directional hypothesis |
H0 = acupuncture does not affect pain tolerance H1 =acupuncture affects pain tolerance |
|
|
directional hypothesis |
H0 =acupuncture does not affect or decrease pain tolerance H1 =acupuncture increases pain tolerance |
|
|
p value |
the probability that the numerical results we observed were due to chance alone EX. p= .045 ... there is a .045 probability/4.5% chance that these results are due to chance |
|
|
a value |
alpha - simply a decision criteria - usually set to a=.05 |
|
|
reject the null when... |
p < a |
|
|
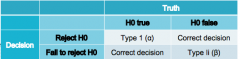
type 1 error |
we reject the null but the null was true - alpha reduces this |
|
|
type 2 error |
we fail to reject the null, but the null was false - beta value can reduce this |
|
|
hypothesis testing (reference picture) |
|