![]()
![]()
![]()
Use LEFT and RIGHT arrow keys to navigate between flashcards;
Use UP and DOWN arrow keys to flip the card;
H to show hint;
A reads text to speech;
11 Cards in this Set
- Front
- Back
|
Statistics |
the science of gathering, analyzing, interpreting and presenting data. |
|
|
Mean |
a measure of central tendency. It is associated with symmetrical or normal distribution. |
|
|
Standard deviation |
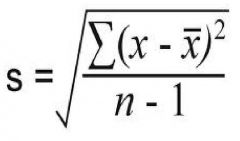
a measure of the dispersion of values from the mean. It helps describe the normal curve. A measure of the distribution range. |
|
|
Coefficient variation |
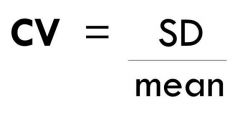
a percentile expression of the mean; an index of precision. |
|
|
Variance |
is called the standard deviation squared; a measure of variability. V=SD(2) |
|
|
Median |
is the value of the observation that divides the observations into two groups, each containing equal numbers of observations. It is the midpoint of a distribution; 50th centile. |
|
|
Mode |
is the most frequent observation |
|
|
Inferential statistics |
are used to compare the means or standard deviations of two groups of data. |
|
|
T test |
is used to determine whether is a statistically significant difference between the means of two groups of data. |
|
|
F-test |
is used to determine whether there is a statistically significant difference between the standard deviations of two groups of data. |
|
|
Standard Deviation Index (SDI) |
– the difference between the value of a data point and the mean value divided by the group’s SD. |