![]()
![]()
![]()
Use LEFT and RIGHT arrow keys to navigate between flashcards;
Use UP and DOWN arrow keys to flip the card;
H to show hint;
A reads text to speech;
20 Cards in this Set
- Front
- Back
|
Class |
A group used for classifying the data |
|
|
Cumalitive frequency |
The total number of frequenciesmor observations that are less than or equal to a certain value |
|
|
Database |
An organized collection of data |
|
|
Frequency table |
A way of presenting data showing the number of items or the number of items in each group |
|
|
Open ended |
No finishing value or no starting value |
|
|
Tally |
A way of counting values |
|
|
Two way table |
A way of showing two categories of data |
|
|
Bar chart |
A chart in which the length of a bar (rectangle), drawn to scale, represents the frequency |
|
|
Pictogram |
A diagram in which a number of symbols of images represents the frequency |
|
|
Stem and leaf |
A diagram that shows the distribution of data. The stem is the first digit(s) and the leaf is the last digit(s). |
|
|
Stem and leaf |
A diagram that shows the distribution of data. The stem is the first digit(s) and the leaf is the last digit(s). |
|
|
Pie chart |
A diagram showing how something is shared or divided up. |
|
|
Angle of a sector = |
Actual share ------------------- × 360° Total being shared |
|
|
Cumulative frequency step polygon |
This shows how the cumulative frequency goes up at each value but stays level between values |
|
|
Composite bar chart |
A bar chart in which two (or usually more) bar charts are combined by putting the bars for each category one above the other in a single bar |
|
|
Multiple bar chart |
Two or more bar charts combined so that for each class there are two or more bars. |
|
|
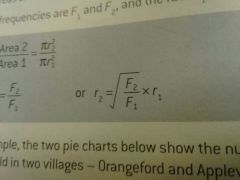
Comparative pie chart |
Two pie charts drawn so that their total areas are in the same proportions as their total frequencies |
|
|
Pie chart |
A chart that shows you how something is shared or divided up |
|
|
Equation for finding missing radius from one comparative pie chart? |
|
|
|
Equation for length of radius of comparative pie charts |
r2 (square root) f1 ---- = ------------------------- r1 (square root) f2 |