![]()
![]()
![]()
Use LEFT and RIGHT arrow keys to navigate between flashcards;
Use UP and DOWN arrow keys to flip the card;
H to show hint;
A reads text to speech;
30 Cards in this Set
- Front
- Back
- 3rd side (hint)
|
Frequency distribution
|
When working with large data sets, it is often helpful to organize and summarize data by constructing a table.
|
|
|
|
Frequency Distribution
(or Frequency Table) |
shows how a data set is partitioned among all of several categories (or classes) by listing all of the categories along with the number (frequency) of data valuesin each of them.
|
|
|
|
Lower Class Limits
|
are the smallest numbers that can actually belong to different classes
|

|
|
|
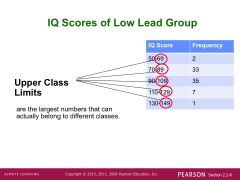
Upper Class Limits
|
are the largest numbers that can actually belong to different classes
|

|
|
|
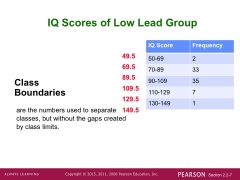
Class Boundaries
|
are the numbers used to separate classes, but without the gaps created by class limits.
|
|
|
|
Class Midpoints
|
are the values in the middle of the classes and can be found by adding the lower class limit to the upper class limit and dividing the sum by 2.
|
|
|
|
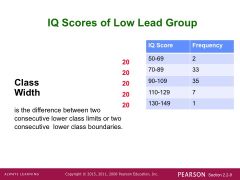
Class Width
|
is the difference between two consecutive lower class limits or two consecutive lower class boundaries
|
|
|
|
Reasons for Constructing Frequency Distributions
|
1. Large data sets can be summarized.
2. We can analyze the nature of data. 3. We have a basis for constructing importantgraphs. |
|
|
|
Constructing A Frequency Distribution step 1
|
Determine the number of classes (should be between 5 and 20)
|
|
|
|
Constructing A Frequency Distribution step 2 |
Calculate the class width (round up).
|

|
|
|
Constructing A Frequency Distribution 3 (Starting point)
|
Choose the minimum data value or a convenient value below it as the first lower class limit
|
|
|
|
Constructing A Frequency Distribution 4 |
Using the first lower class limit and class width, proceed to list the other lower class limits. |
|
|
|
Constructing A Frequency Distribution 5 |
List the lower class limits in a vertical column and proceed to enter the upper class limits. |
|
|
|
Constructing A Frequency Distribution 6 |
Take each individual data value and put a tally mark in the appropriate class. Add the tally marks to get the frequency. |
|
|
|
Class Width
|
is the difference between two consecutive lower class limits or two consecutive lower class boundaries
|

|
|
|
Reasons for Constructing Frequency Distributions
Step 1 |
Large data sets can be summarized.
|
|
|
|
Reasons for Constructing Frequency Distributions
Step 2 |
We can analyze the nature of data.
|
|
|
|
Reasons for Constructing Frequency Distributions
Step 3 |
We have a basis for constructing important graphs.
|
|
|
|
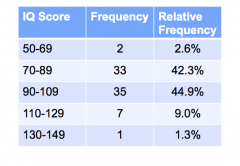
Relative Frequency Distribution
|
Includes the same class limits as a frequency distribution, but the frequency of a classis replaced with a relative frequencies (a proportion) or a percentage frequency ( a percent)
|
|
|
|
relative frequency =
|
class frequency
sum of all frequencies |
|
|
|
percentage frequency=
|
class frequency
sum of all frequencies x 100 |
|
|
|
Relative Frequency Distribution
|
|
|
|
|
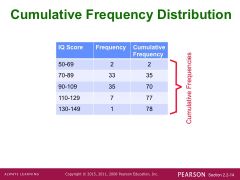
Cumulative Frequency Distribution
|
|
|
|
|
Critical Thinking: Using Frequency Distributions to UnderstandData 1
|
The frequencies start low, then increase to one or two high frequencies, and then decrease to a low frequency.
|
|
|
|
Critical Thinking: Using Frequency Distributions to Understand Data 2
|
The distribution is approximately symmetric, with frequencies preceding the maximum being roughly a mirror image of those that follow the maximum.
|
|
|
|
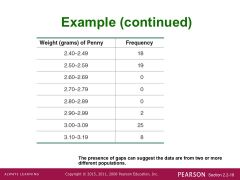
Gaps
|
The presence of gaps can show that we have data from two or more differentpopulations.
|
|
|
|
Gaps 2
|
However, the converse is not true, because data from different populations do not necessarily result in gaps.
|
|
|
|
Example
|
Thetable on the next slide is a frequency distribution of randomly selected pennies.
The weights of pennies (grams) are presented, and examination of the frequencies suggests we have two different populations |
|
|
|
Example 2 |
Pennies made before 1983 are 95% copper and 5% zinc.
Pennies made after 1983 are 2.5% copper and 97.5% zinc. |
|
|
|
Example (continued)
|
|
|