![]()
![]()
![]()
Use LEFT and RIGHT arrow keys to navigate between flashcards;
Use UP and DOWN arrow keys to flip the card;
H to show hint;
A reads text to speech;
125 Cards in this Set
- Front
- Back
|
The science of collecting, organizing, and INTERPRETING data |
Statistics def #1 |
|
|
The actual data that describes something |
Statistics def #2 |
|
|
The whole group you want to know something about |
Population |
|
|
subgroup of the population from which data is collected |
Sample |
|
|
the characteristic you want to know |
Population Parameter |
|
|
the numbers and observations about the characteristic from the sample |
Sample Statistics |
|
|
State the goal of your study PRECISELY (who and what) |
5 Basic steps, step one |
|
|
Choose a representative sample |
5 Basic steps, step two |
|
|
Collect the data from the sample and summarize what we learned |
5 Basic steps, step three |
|
|
Use the sample statistics to infer the population parameter |
5 Basic steps, step four |
|
|
Draw conclusions about the study itself. Determine what could be done better the next time you do the study |
5 basic steps, step five |
|
|
a sample in which the relevant characteristics of the sample members are generally the same as those of the population |
representative sample |
|
|
Sample method where you choose a sample of items in such a way that every sample of the same size has an equal chance of being selected |
simple random sampling |
|
|
sample method where you use a simple system to choose the sample, such as selecting every 10th or 50th member of the population. |
systematic sampling |
|
|
sampling method where you choose a sample member that is easy to select |
convenience sampling |
|
|
sampling method where you partition the population into at least two strata (groups) and then draw a sample from each |
stratified sampling |
|
|
in a statistical study where the design or conduct tends to favor a certain result(s) |
Bias |
|
|
researchers observe or measure characteristics of the sample members but do not attempt to influence or modify these characteristics |
observational study |
|
|
researchers apply a treatment to some of all of the sample members and then observe the effects of the treatment |
experiment |
|
|
a group in an experiment whose members receive the treatment being tested |
treatment group |
|
|
a group in an experiment whose members DO NOT receive the treatment being tested |
control group |
|
|
a treatment that lacks the active ingredients of the treatment being tested in a study but looks and feels identical to the treatment so that participants cannot distinguish whether they are receiving the placebo or the real treatment |
placebo |
|
|
the situation in which patients improve simply because they believe they are receiving a useful treatment |
placebo effect |
|
|
in an experiment, the participants do not know whether they are members of the treatment or control group, but experimenters do know |
single-blind |
|
|
neither the participants nor the experimenters know who belongs to the treatment group and who belongs to the control group |
double-blind |
|
|
an observational, retrospective, study that resembles an experiment because the sample naturally divides into two of more groups |
case-control study |
|
|
the participants who engage in the behavior under retrospectivestudy form ________, which makes them like a treatment group |
cases |
|
|
the participants who DO NOT engage in the behavior under retrospectivestudy form ________, which makes them like a control group |
controls |
|
|
The _______ __ ________ in a statistical study used to describe a ________ ________ that is likely to contain the true population parameter. |
margin of error confidence interval |
|
|
from (sample statistic - margin of error) to (sample statistic + margin of error) |
confidence interval |
|
|
Should you believe? look for the goal, clear population, type of study (obs or exp), blind, random. Was it appropriate |
Guideline 1: Get a Big Picture of the Study |
|
|
Should you believe? evaluate for potential biases that might invalidate its conclusions. researchers pressured to produce results the funding company likes |
Guildeline 2: Consider the Source |
|
|
occurs whenever researchers select their sample in a way that tends to make it unrepresentative of the population. |
selection bias |
|
|
occurs whenever people choose whether to participate |
participation bias |
|
|
Should you believe? is the sample representative of the population, how was the population selected |
Guideline 3: Look for Bias in the Sample |
|
|
any item or quantity that can vary or take on different values. items or quantities that the study seeks to measure |
variable |
|
|
Should you believe? How was the study measured |
Guideline 4: Look for Problems in Defining or Measuring the Variables of Interest |
|
|
variables that are not intended to be part of the study can sometimes make it difficult to interpret results properly |
confounding veriables |
|
|
Should you believe? Are there other variables that take on different values which may affect the results |
Guideline 5: Beware of Confounding Variables |
|
|
Should you believe? can produce inaccurate or dishonest responses, especially for sensitive subject |
Guideline 6: Consider the Setting and Wording in Surveys |
|
|
Should you believe? misrepresenting data in graphs or concluding statements; maybe misinterpreted results from researchers or jump to conclusions, or make exaggerated conclusions |
Guideline 7: Check that Results are Presented Fairly |
|
|
Should you believe? ask: Did the study achieve it's goals? Did conclusions make sense? Is there any alternative results? |
Guideline 8: Stand Back and Consider the Conclusions |
|
|
has 2 columns (categories and frequency) |
frequency table
|
|
|
first column in a frequency table, lists names of data |
categories |
|
|
the numbers, data values in the category |
frequency |
|
|
fraction (percentage) of data values frequency in category / total frequency |
relative frequency |
|
|
the number of values at or above that point (that categories plus all preceding categories) |
cumulative frequency |
|
|
2 types of data |
qualitative and quantitative data |
|
|
describes a quality or non-numerical data |
qualitative data |
|
|
counts or measurement data |
quantitative data |
|
|
group the data into categories that cover a range of possible values |
binning data |
|
|
set of bars to represent the frequency or relative frequency |
bar graph |
|
|
must always represent the total relative frequency of 100% and the proportion of the circle is the same as the % |
pie charts |
|
|
Label on graph explains what is shown in the graph and source of the data |
title |
|
|
Label on graph numbers on vertical axis with tick marks to indicate scale and the variable name of the vertical axis |
vertical scale and title |
|
|
Label on graph names indicating the items in the horizontal scale, which may or may not include tick marks indicating a scale and the variable name of the horizontal axis |
horizontal scale and title |
|
|
Label on graph only required when multiple sets of data are on the same graph; key |
legend |
|
|
a bar graph in which the data categories are quantitative; must follow the natural order of the numerical categories |
histogram |
|
|
serves the same purpose as a histogram, uses connected dots instead of bars |
line chart |
|
|
a line chart or histogram with the horizontal axis representing time |
time-series graph |
|
|
exists between two variables when higher values of one variable consistently go with higher values of another variable |
Definition of Correlation ~ Positive example |
|
|
when higher values of one variable consistently go with lower values of another variable |
Definition of Correlation ~ Negative example |
|
|
When there is no pattern between variables |
No correlation |
|
|
When both variables increase or decrease together |
positive correlation |
|
|
when one variable increases and the other decreases |
negative correlation |
|
|
how closely two variables follow a pattern |
strength of correlation |
|
|
coincidence |
possible explanation for a correlation (1) |
|
|
common underlying cause |
possible explanation for a correlation (2) |
|
|
Direct Cause one variable causes the other |
possible explanation for a correlation (3) |
|
|
look for a situation in which two variables are correlated regardless of whether other factors vary |
Guidelines for Establishing Causality (1) |
|
|
Among groups that differ only in the presence or absence of the suspected cause, check that the effect is similarly present or absent |
Guidelines for Establishing Causality (2) |
|
|
Look for evidence that larger amounts of the suspected cause produce larger amounts of the effect. |
Guidelines for Establishing Causality (3) |
|
|
If the effect might be produced by other potential causes (besides the suspected cause), make sure that the effect still remains after accounting for these other potential causes. |
Guidelines for Establishing Causality (4) |
|
|
If possible, test the suspected cause in an experiment. |
Guidelines for Establishing Causality (5) |
|
|
Determine the physical mechanism by which the suspected cause produces the effect |
Guidelines for Establishing Causality (6) |
|
|
discover a correlation, but cannot determine whether the correlation implies causality
start criminal investigation |
Levels of Confidence in Causality Possible Cause |
|
|
reason to suspect correlation is cause & effect relationship (3 or 4 guidelines are met)
Issue a search warrent |
Levels of Confidence in Causality Probable Cause |
|
|
found model that one thing causes another, it seems unreasonable to doubt the model
convict of crime |
Levels of Confidence in Causality Cause Beyond Reasonable Doubt |
|
|
data set describes the values taken on by the variable & the frequency of each value |
distribution |
|
|
sum of all values / the number of values added |
Mean |
|
|
the middle value of the ordered data
if there is an even number if values, it is the mean of the middle two |
Median |
|
|
the value or values that occur most frequently
List like this: x or {x,y} or {x,y,z} |
Mode |
|
|
a data value that is much higher or much lower than almost all other values. |
Definition of Outlier |
|
|
what can change the mean but has no affect on the median or mode? |
answer: outlier |
|
|
What average should we use? 1,2,3,4,5,25 |
answer: do not use Mean when there is an outlier use median or mode |
|
|
Unimodal |
Shape of Distribution one peak |
|
|
Bimodal |
Shape of Distribution two peaks |
|
|
Uniform |
Shape of Distribution categories have same frequency |
|
|
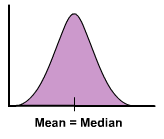
the left hand is a mirror image of the right half |
symmetric |
|
|
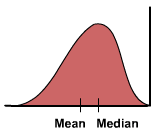
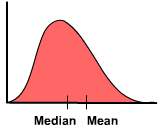
the distribution data values are more spread out on the named side |
skewed (left or right) |
|
|
image of symmetric |
|
|
image of left skewed |
|
|
image of right skewed |
|
|
how wide the data is spread |
defination of variation |
|
|
the simplest way to describe variation is |
range |
|
|
lowest, lower quartile, median, upper quartile, highest |
5 Number Scores |
|
|
the quartile that divides the lower |
lower quartile |
|
|
when finding the upper or lower quartile, what do you not include |
do not include the median |
|
|
Whisker and box plot the one with the most variation has |
the largest space between quartiles |
|
Greek letter sigma |
Standard Deviation |
|
|
Standard Deviation equation |
Square root ((sum of deviation from mean)squared / n - 1 |
|
|
calculate standard deviation steps using calculator |
data: list 1: enter all numbers in set 2nd data: enter 3 times |
|
|
used to approximate the standard deviation |
Range Rule of Thumb |
|
|
range rule of thumb equation |
St Dev = range/4 |
|
|
Lowest value approx= |
mean-2(st dev) |
|
|
Highest value approx= |
mean+2(st dev) |
|
|
symmetric bell shape curve with a well-defined peak |
Definition for Normal Distribution |
|
|
most data values are clustered near the mean giving a well defined peak |
#1 condition for a normal distrubition |
|
|
Data values are spead evenly about the mean making the distribution symmetric |
#2 condition for a normal distrubition |
|
|
Larger deviations from the mean become scarcer giving the tapered tails on the ends |
#3 condition for a normal distrubition |
|
|
Individual data values are a result of several different factors |
#4 condition for a normal distrubition |
|
|
68% falls within |
1 standard deviation |
|
|
95% falls within |
2 standard deviations |
|
|
99.7 falls within |
3 standard devations |
|
|
# of standard deviations from mean |
Definition for Standard Score or Z-Score |
|
|
Standard Score or Z-Score = |
(data value - mean) / Standard deviation |
|
|
the smallest value in which n% of the data values are at or below that data value (round down) |
Definition for Nth Percentile of a data set |
|
|
using the sample statistic to learn something about the population |
Definition for Statistical Inference |
|
|
If it is unlikely to happen by chance and small variations do happen by chance |
Definition for Statistical Significant |
|
|
Close to what we are expecting |
Definition for Not Significant |
|
|
Far from what is expected |
Definition for Significant |
|
|
The probability of an observed difference occurring by chance is 1 in 20 (0.05) or less, the difference is significant at the 0.05 level |
Definition for Quantifying Significance #1 |
|
|
The probability of an observed difference occurring by chance is 1 in 100 (0.01) or less, the difference is significant at the 0.01 level |
Definition for Quantifying Significance #2 |
|
|
(Sample stat - m of e) to (sample stat + m of e) = |
95% confidence interval |
|
|
Margin of Error approximately = |
1/square root n |