![]()
![]()
![]()
Use LEFT and RIGHT arrow keys to navigate between flashcards;
Use UP and DOWN arrow keys to flip the card;
H to show hint;
A reads text to speech;
74 Cards in this Set
- Front
- Back
- 3rd side (hint)
|
Theory |
An explanation for a phenomenon that can be falsified and that involves entities that cannot be directly observed |
You have to be able to prove it what and with what? |
|
|
Falsification |
A theory must be able to generate predictions, as such there must be a set of hypothetical facts that would prove the theory false It must involve entities that cannot be observed |
|
|
|
Hypothesis |
A statement about the possibility let relationship between observable variables |
|
|
|
Falsifiability Criterion |
Must always be possible to prove that a scientific theory is false |
|
|
|
Modus Ponens |
P is theory Q is hypothesis If P is true, then Q is true P is true Therefore, Q is true A valid argument, but not useful in science because it assumes the theory is true. |
|
|
|
Affirming the Consequent |
If P is true, then Q is true. Q is true. Therefore, P is true. Not a valid argument. |
|
|
|
Modus Tollens |
If P is true, then Q is true Q is *not* true Therefore, P is not true
Both a valid argument and useful to science. |
|
|
|
Naturalistic Observation |
A research technique where the researcher simply observes and describes behavior |
|
|
|
Correlational Approach |
A research tech in which the researcher determines the relationship between variables without manipulating the variables |
|
|
|
Best Correlational Use Cases |
1) Manipulating the variables would be difficult or impossible 2) Manipulating the variables would be unethical |
There are two of them about the variables |
|
|
Causation |
A causal relationship exists between two variables if a change in one results in a change in the other |
|
|
|
Independent Variables |
**VERY IMPORTANT** The variable for which the researcher chooses values |
|
|
|
Dependent Variable |
The variable the researcher measures to determine the effect of the independent variable |
|
|
|
Levels of the Independent Variable |
The specific values of the IV that a researcher chooses to use in an experiment |
|
|
|
Between Subjects Design |
Research design in which each subject receives one of the IV |
|
|
|
Within Subjects Design |
Research design in which each subject receives *all* levels of the IV |
|
|
|
Random Selection |
Occurs when every member of the population to which we would like to generalize the results has an equally likely chance to participate in the research |
|
|
|
Random Assignment |
Once the participants for a study have been chosen, random assignment occurs when each participant had an equally likely chance to be assigned each IV level (in a BSD) or to each treatment order (in a WSD) |
|
|
|
Experiment |
A research technique that has two things:
1) Random assignment 2) The researcher manipulates the IV
In contrast to other techniques, experiments allow the researcher to infer causation. |
|
|
|
Quasi-Experiments |
Research technique in which the researcher manipulates the IV, but which fails to have random assignment |
|
|
|
Investigation |
Research techniques that doesn't allow a researcher to infer causation. Naturalistic observation, correlation approach, and quasi-experiments are all investigations. |
|
|
|
Experiments Can't Be Done When... |
1) Difficult or impossible to manipulate the IV 2) Unethical to manipulate the IV 3) Random assignment cannot be done |
|
|
|
Frequency Distribution |
A graph showing the number of times each score occurred in a data set |
|
|
|
Normal Distribution |
A symmetrical, bell-shaped distribution |
|
|
|
Positively Skewed Distribution |
A distribution with a few extreme high scores |
|
|
|
Negatively Skewed Distribution |
A distribution with a few extreme low scores |
|
|
|
Comparison of Mean and Median |
1) Extreme Scores Normal: Mean = Median Positively: Mean > Median Negatively: Mean < Median 2) Consistency The mean is more consistent across repeated samples. 3) Ease of Calculation The mean is usually easier to calculate than the median |
|
|
|
Sum of Squares Formula |
sum( (X-_X)^2 ) Or sum( X^2 ) - ( (sum( X ))^2 / N ) |
|
|
|
Standardized Scores (z scores) |
Standardized scores allow scores on different scales to be compared by placing all scores on a common scale. All sets of standardized scores have a mean = 0 and a standard deviation = 1 |
|
|
|
Scales of Measurement: Identity |
Occurs when different entities receive different scores on the scale |
|
|
|
Scales of Measurement: Magnitude |
Occurs when the ordering of the values on the scale reflects the ordering of the trait being measured Ex: running, weight in lbs Non-Ex: Zipcodes |
|
|
|
Scales of Measurement: Equal Intervals |
Occurs when a difference of 1 on the scale represents the same amount of trait being measured everywhere on the scale |
|
|
|
Scales of Measurement: Absolute Zero |
Occurs when a 0 on the scale represents a complete absence of the trait being measured |
|
|
|
Types of SoM: Nominal |
Have only the identity property Ex: zipcodes, jersey numbers NO ARITHMETIC OPERATIONS ARE MEANINGFUL HERE |
|
|
|
Types of SoM: Ordinal |
Has only the identity and magnitude properties Ex: basketball rankings, class ranks NO ARITHMETIC OPERATIONS ARE MEANINGFUL HERE |
|
|
|
Types of SoM: Interval |
Has only the identity, magnitude, and equal intervals properties Ex: Fahrenheit and Celsius Addition and subtraction are meaningful, but multiplication and division is not |
|
|
|
Types of SoM: Ratio |
Has the identiry, magnitude, equal intervals, and absolute zero properties Ex: weight in lbs, # right on a test, Kelvin ALL arithmetic operations are meaningful here |
|
|
|
Advantages of Within Subjects Design |
1) Allows the use of fewer subjects to obtain the same number of observations 2) Allows for greater statistical power than between subjects Use this whenever possible. |
|
|
|
Problems with Within Subject Designs |
1) Practice effects 2) Sensitization effects 3) Carry-over effects |
|
|
|
Counterbalancing |
A method of assigning subjects to treatment orders in a within subjects design that, across subjects, practice effects are balanced |
|
|
|
Methods of Counterbalancing |
1) Use all possible treatment orders (4 or fewer independent variable levels) 2) Use a Latin Square |
|
|
|
Latin Square |
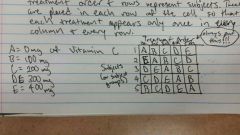
As many columns and rows as there are IV levels.
Columns represent treatment order and rows represent subjects. Treatments are placed in each row of the cell so that each treatment appears only once in every column and every row. |
|
|
|
Sensitization Effects |
Occur when the subject realizes what the manipulations are in a study and such awareness causes a change in behavior |
|
|
|
Practice Effects |
Occurs when a subject's performance on the experimental task changes either for the better or worse as a result of experience with the task |
|
|
|
Carry-over Effects |
Occur when the effects of one treatment persist when another treatment is introduced |
|
|
|
W2U: Test of a Single Sample Mean |
Used to compare a sample mean to a standard value (for which the sample is unvailable) |
|
|
|
Internal Validity |

The extent to which a study provides a valid test of the relationship between the IV and the DV |
|
|
|
Type I Error |
Finding an effect of the IV on the DV when in reality no effect exists (False positive) |
|
|
|
Type II Error |
Failing to find an effective of the IV on the DVD when, in reality, an effect exists. (False negative) |
|
|
|
Alpha (a) |
The probability of making a Type I error, given that the experiment found an effect of the IV on the DV Usually 0.05 |
|
|
|
Beta (B) |
The probability of making a Type II error given that the experiment failed to find and effect of the IV on the DV |
|
|
|
Statistical Power |
The probability that a given experiment will find an effect of the IV on the DV given that an effect exists
Power + B = 1 It is desirable for an experiment to have high statistical power because it lowers Type II errors |
|
|
|
Factors Determining Statistical Power |
1) (a) level: larger gives more power but also increases chances of making Type I error
2) Effect Size: the size of the IV's effect on the DV, larger gives more power
3) Variability in the DV: lower variability gives more power
4) Sample Size*: larger sample size gives more power
(In between subjects only) 5) The correlation between the IV levels: larger correlation between the IV levels gives more power * Most effective way to raise power |
|
|
|
Increasing the Statistical Power |
1) Choose IV levels that will maximum the effect size 2) Try to lower the variability in the data 3) Increase sample size |
|
|
|
Factors that can increase Type II Errors |
1) Nuisance Variables 2) Floor and Ceiling Effects 3) Narrowing of the IV |
|
|
|
Nuisance Variables |
Any variable other than the IV that effects the DV |
|
|
|
Floor and Ceiling Effects |
Occur when the DV is so low (floor, too easy) or so high (ceiling, too hard) that it is unlikely to be effected by the IV |
|
|
|
Narrowing of the IV |
Occurs when the IV levels are so similar that their effects on the DV cannot be distinguished |
|
|
|
Can't Prove the Null Hypothesis |
It is impossible to prove that an IV has no effect on a DV |
|
|
|
Factors Producing Type I Errors |
1) Regression to the Mean 2) Confounds |
|
|
|
Regression to the Mean |
The tendency of extreme values of a variable to fall closer to the group mean when tested Can be countered with a control group |
|
|
|
Control Group |
A group of subjects in a between subjects design that receives a treatment we know is ineffective at changing the DV |
|
|
|
Confound |
A nuisance variable that varies non-randomly with the IV Can produce both TI and TII errors |
|
|
|
How is the logic of experimentation ruined by confounds? |
We assume the only difference in the IV levels is the IV. If you have a confound in your experiment, then it is impossible to know whether it was the IV or the confound that was responsible for the changes in the DV |
|
|
|
Types of Confounds |
1) Confounds due to subject assignment: occur when subjects at different IV levels differ on some variable prior to IV manipulation 2) Confounds due to manipulation of the IV: occur when additional, unanticipated changes accompany IV manipulation |
|
|
|
External Validity |
The extent to which the results of a study can be applied outside the research situation |
|
|
|
Random Factor |
And I whose levels were chosen randomly from a population of possible values Reliable effects of random factors can be generalized across off levels in the population |
|
|
|
Fixed Factor |
An IV whose levels were chosen non-randomly Do not generalize beyond the levels tested |
|
|
|
Demand Characteristics |
Aspects of a study that indicate to subjects how they are expected to respond |
|
|
|
Experimenter Expectancy Effect (Rosenthal Effect) |
A demand characteristic that occurs when subjects change their behavior due to intentional cues from the researcher |
|
|
|
Placebo Effect |
A demand characteristic that occurs when subjects change their behavior as a result of their expectation that change will occur |
|
|
|
Ways to Overcome Placebo and Rosenthal Effects |
1) Single Blind Study: an experiment in which the subject is unaware of which treatment they have received 2) Double Blind Study: an experiment in which both the subject and experimenters don't know which condition the subject is in Double blind cures both, single blind only cures placebo |
|
|
|
Hawthorne Effect |
A demand characteristic that occurs when subjects change their behaviour because they know they are being watched |
|
|
|
Novelty Effect |
Occurs when the IV influences the DV only because the IV is something new |
|