Reading...
![]()
Play button
![]()
Play button
![]()
Use LEFT and RIGHT arrow keys to navigate between flashcards;
Use UP and DOWN arrow keys to flip the card;
H to show hint;
A reads text to speech;
170 Cards in this Set
- Front
- Back
|
What is statistics?
|
-the practice of analyzing numerical data
-a set of math procedures to organize, summarize, and interpret -telling a story with data |
|
|
Why is statistics important?
|
-doing and understanding research
-criticize -replicate |
|
|
What is a population?
|
-the set of all the individuals of interest in a particular study (ie Canadians, women, preteens etc)
|
|
|
Does a population have to be made up of people?
|
no, can be rats, corporations, parts made in a factory, etc
|
|
|
What is a sample?
|
a set of individuals selected from a population , usually to represent the population in a research study
|
|
|
What is the relationship between a sample and a population?
|
-the sample is selected from the population, sample participates in study, results are generalized to the population
|
|
|
What two general categories can statistical procedures be classified into?
|
-descriptive and inferential
|
|
|
what are descriptive statistics?
|
-procedures that summarize, organize, and simplify data
-results in tables, graphs, or single numbers that consolidate a large amount of information (ie average) |
|
|
What is the difference between a parameter and a statistic?
|
-a parameter is a characteristic that describes a POPULATION (ie population average)
-a statistic is a characteristic that describes a SAMPLE |
|
|
What are inferential statistics?
|
-techniques that use sample data to make generalizations about populations
|
|
|
we use sample statistics to infer what the ______________________ is likely to be.
|
population parameter
|
|
|
What is sampling error?
|
-the discrepancy (difference, amount of error) between a sample statistic and its population parameter
-sample statistics vary from one sample to another and typically are different from the corresponding population parameters |
|
|
What is a common example of sampling error?
|
-sample proportion (ie voting, female/male ratio etc)
|
|
|
What is sampling error caused by?
|
-chance
-sampling bias |
|
|
What are the steps to using statistics in research?
|
1: Experiment (ie Group A coffee, Group B water)
2: Descriptive Statistics (results: A=4hrs, B=2hrs) 3: Inferential Statistics (sample data show a 2 hr difference) |
|
|
we use ___________ statistics to decide whether results are a real difference, or due to sampling error
|
-inferential
|
|
|
What is a variable?
|
a characteristic or condition that changes or has different values for different individuals
|
|
|
What are the two main kinds of variables?
|
-characteristics that differ from person to person
-environmental conditions that change |
|
|
What is a data set?
|
the complete set of data/scores
|
|
|
What is a datum? More commonly called?
|
-the measurement or observation obtained for each individual
-AKA a score or raw score |
|
|
Most research is intended to examine the ____________________.
|
relationship between variables
|
|
|
What is a constant? AKA
|
-a characteristic or condition that does not change across individuals
-AKA controlled variable |
|
|
What to quantitative and qualitative variables measure differences in?
|
quantitative = amount
qualitative = type |
|
|
Quantitative variables _______ event, while qualitative variables ______ event.
|
quantitative = quantify
qualitative = categorize |
|
|
What are constructs? aka?
|
-internal attributes or characteristics (variables) that cannot be directly observed, but are useful for describing and explaining behaviour
-aka “hypothetical constructs” |
|
|
How can we measure a construct?
|
-by observing and measuring behaviours that are representative of the construct
-the external behaviours can be used to create an operational definition of the construct |
|
|
What are the two components of an operational definition?
|
-describes a set of operations for measuring a construct
-defines the construct in terms of the resulting measurements |
|
|
What are “real limits” for continuous variables?
|
-the boundaries of intervals for scores that are represented on a continuous number line
-positioned exactly halfway between adjacent scores |
|
|
What is one key to determining whether a variable is continuous or discrete?
|
-continuous variables can be divided into any number of fractional parts
-whenever you are free to choose the degree of precision or the number of categories for measuring a variable, it must be continuous |
|
|
What is an interval width?
|
upper real limit – lower real limit
|
|
|
What are the four scales of measurement, from simplest to most sophisticated?
|
nominal, ordinal, interval, and ratio
|
|
|
What is the nominal scale of measurement?
|
-categories with different names (nominal = name)
-qualitative, not quantitative differences between categories -no information on direction or size of difference between categories |
|
|
What is the ordinal scale of measurement?
|
-named categories in an ordered sequence, ranked by size or magnitude
-know order (rank) of objects, but no info about size of intervals between ranks -ie gold vs silver, we know one is better than the other, but not by how much |
|
|
What is the interval scale of measurement?
|
-ordered categories with intervals of equal size
-no rational/absolute zero point (if you can have negative numbers, it’s an interval scale ie celcius) -any time you are measuring a construct |
|
|
Can a construct be measured using a ratio scale?
|
NO!
|
|
|
What is the ratio scale of measurement?
|
-ordered categories with intervals of equal size and rational (absolute) zero point
-basically interval scale + zero point (and not a construct) -can form meaningful ratios |
|
|
What are the two distinct data structures used to classify different research methods and statistical techniques?
|
-two different variables in same individual: correlational method
-two (or more) groups of scores: experimental and non-experimental methods |
|
|
Can we use the correlational method to produce non-numerical scores? How are they evaluated?
|
yes, chi-square test
|
|
|
What is the correlational method of observing variables?
|
-observe two variables to see whether there is a relationship between them
-looking for things that change together |
|
|
What is the correlational method incapable of demonstrating?
|
-an explanation of the relationship
-a cause-and-effect relationship |
|
|
What do the experimental and non-experimental methods compare?
|
-two (or more) groups of scores to find differences between the groups
-one variable defines the groups, the other variable is measured to create scores for each group |
|
|
What is the goal of the experimental method?
|
-to determine whether there is a cause and effect relationship between variables
-to show that changing the value of one variable will cause changes to occur in the second variable -ie whether manipulating one variable causes another variable to change |
|
|
What is the difference between the experimental and non-experimental methods?
|
-similar: both study two or more groups of scores to find differences between the scores BUT:
-experimental method includes manipulation and control -non-experimental methods consist of nonequivalent groups and pre-post studies |
|
|
What two characteristics differentiate experiments from other types of research studies?
|
-manipulation: of independent variable (dependent variable is measured to determine whether manipulation causes changes to occur)
-control: over research situation (to avoid confounding variables) |
|
|
What is an independent variable?
|
-the variable being manipulated by the experimenter to create conditions or groups
-the treatment conditions to which subjects are exposed -consists of antecedent conditions that were manipulated PRIOR to observing the dependent variable |
|
|
What is a dependent variable?
|
-the variable being measured or observed (across all conditions or groups) to assess effect of treatment
|
|
|
Lack of control leads to ____________.
|
confounding variable, confound
|
|
|
What is a confounding variable?
|
-an uncontrolled variable that is unintentionally allowed to vary systematically with the independent variable
|
|
|
What is confound?
|
-being unable to tell whether changes in DV are due to IV or to confounding variable
|
|
|
What are the two types of variables we need to consider for possible confounds?
|
-participant variables: characteristics that are specific to an individual (ie age, intelligence, gender)
-environmental variables: characteristics of the environment (ie temperature, lighting, etc) |
|
|
What are the three basic techniques used to control other variables (possible confounding)?
|
-random assignment: each participant has equal chance of being assigned to each group
-matching: to ensure equivalent groups or environments (ie equal IQ distribution) -holding the variables constant (ie equal age for everyone) |
|
|
What is the control condition?
|
-participants in the control condition do not receive the experimental treatment
-may receive no treatment, placebo, or be placed on a waiting list for treatment -provides a baseline for comparison with the experimental condition |
|
|
When do we use the non-experimental method?
|
-when we want to study the relationship between variables by comparing groups of scores BUT we cannot randomly assign participants to groups (lack of control) or manipulate the independent variable
|
|
|
What are two common examples of non-experimental methods?
|
non-equivalent groups and pre-post studies
|
|
|
What are non-equivalent group studies?
|
-non-experimental method comparing preexisting groups
-participants cannot be randomly assigned to groups because the grouping variable is a participant variable (ie gender, age, intelligence) |
|
|
What are pre-post studies?
|
-non-experimental method comparing before and after scores
-in this case, time is the independent variable: experimenter has no control over the passage of time (or any variable that changes with time) |
|
|
What is the difference between a pre-post study and a correlational study?
|
-they are similar in that both designs measure two scores for the SAME individual, however:
-correlational: the two scores correspond to two DIFFERENT variables (ie sleep time VS GPA) -pre-post design: two scores correspond to SAME variable twice under two different conditions at different times |
|
|
What is a quasi-independent variable? Why is it not a TRUE independent variable?
|
-the “independent variable” that is used to create the different groups of scores in a nonexperimental study
-not a true independent variable because it is not manipulated |
|
|
What do Σ and ΣX mean?
|
Σ = summation, “the sum of” (sigma)
ΣX = “sum of the scores” (add all the scores for variable X) |
|
|
What are the rules of operation for the math in statistical notation?
|
-brackets
-exponents -division/multiplication -***Σ (summation) using Σ notation*** -any other addition/subtraction |
|
|
What is the purpose of frequency distributions in organizing raw data?
|
-provides an overview of the entire group of scores, making it easy to present an entire set of scores
|
|
|
Descriptive statistics are a way of __________ and ___________ data.
|
summarizing and organizing
|
|
|
What are the three ways we can summarize/organize data?
|
- tabular representation of data (frequency distributions)
- graphical representation of data (histograms, bar graphs, polygons) -numerical representations of data (central tendency, ) |
|
|
What is relative frequency? How do we calculate it? aka
|
-aka proportion (p)
-what proportion (fraction) of the overall group is associated with each score -proportion = p = f/n |
|
|
What are the groups in a grouped frequency distribution called?
|
-class intervals
|
|
|
What does a relative frequency distribution table look like?
|
X f p=f/n %=p(100)
|
|
|
What are apparent limits?
|
-the limits that seem to denote the intervals in class intervals (in a group frequency distribution)
-they are called “apparent” because a interval of 60-64 would actually have real limits of 59.5-64.5 etc |
|
|
What are the steps to creating a group frequency distribution?
|
1. Find the range of scores (largest - smallest + 1)
2. Determine the class intervals --use about 10 groups or class intervals --the width of a group or class interval should be a fairly simple number --the bottom score of each class interval should be a multiple of the width --all intervals should be the same width and cover the range of scores with no gaps 3. Create the grouped frequency table |
|
|
What is the difference between relative and cumulative frequency?
|
-relative is proportion of each individual score, cumulative is added up (percentile ranks)
|
|
|
Relative frequency indicates the ______________associated with each X value.
|
proportion or percentage
|
|
|
Percentile rank refers to a ___________ and percentile refers to a _______.
|
-percentage (ie percentile rank of 60%)
-score (ie 60th percentile) |
|
|
What assumption is interpolation based on? Significance?
|
-there is a constant rate of change from one end of the interval to the other
-values calculated are only estimates |
|
|
When constructing a frequency distribution table, how should the height of the Y axis compare to the width of the X axis?
|
-the height should be approximately 2/3 to 3/4 of the length
|
|
|
What graphs would be used for interval or ratio data?
|
-histograms or polygons
|
|
|
What are histograms?
|
-use the frequency distribution in a simple or grouped frequency distribution table to form a graph
x-axis: extends to the real limits of the category (bars touch) y-axis: frequency for each value |
|
|
How do we draw a histogram for data that has been grouped into class intervals?
|
-width of the bar extends to the real limits of the interval
|
|
|
What is a modified histogram?
|
-drawing a stack of blocks above each score, each block representing one individual (blocks correspond to frequency)
-no need for a vertical line (y axis) showing frequencies -provides a sketch, is not a substitute for an accurately drawn histogram |
|
|
What is the difference between a histogram and a bar graph?
|
-histogram = interval or ratio data
-bar = nominal and ordinal data -bar graphs are essentially the same as a histogram, except that spaces are left between bars |
|
|
Why do we use a bar graph instead of a histogram for nominal and ordinal data?
|
nominal scale: the space emphasises that the categories are separate and distinct
ordinal: separate bars are needed because you cannot assume that the categories are all the same size |
|
|
How do you make a distribution polygon?
|
-dots placed at
--exact value for single digit class intervals --midpoint for grouped class intervals (but don’t show grouped intervals on the axis!) -connect the dots -connect the endpoints of the graph to the x axis at the next interval |
|
|
What are possible graphs to use for quantitative data? Qualitative?
|
-quantitative: histogram, frequency polygon
- qualitative: bar chart, pie chart |
|
|
What three characteristics describe any frequency distribution?
|
-shape, central tendency, variability
|
|
|
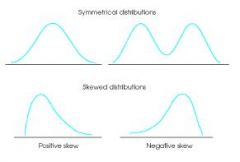
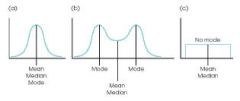
Describe the three main classifications of distribution shape. (image)
|
|
|
|
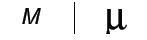
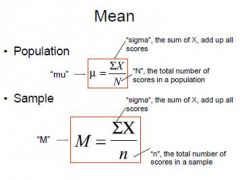
What are the sample and population symbols for Mean?
|
|
|
|
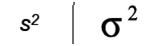
What are the sample and population symbols for Variance?
|
|
|
|
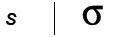
What are the sample and population symbols for Standard Deviation?
|
|
|
|
When do skewed distributions often occur?
|
-negatively skewed: may reflect a ceiling effect (can’t score any higher ie quiz out of 10)
-positively skewed: floor effect (can’t score any lower) |
|
|
What is the purpose of measuring central tendency?
|
- to identify the “average” or “typical” individual by finding the single score that is most typical or most representative of the entire group
-we can use averages from two different groups to describe them and to measure the differences between them |
|
|
What are the 3 methods for determining central tendency?
|
-mean, median, mode
|
|
|
What is the mean?
|
-the sum of all scores divided by the number of scores
-known as the “arithmetic average” -population: represented by greek letter “mu” u -sample: “X bar” (old way) or M |
|
|
Why is the mean known as the “balance point” of a distribution?
|
-the sum of the negative deviations from the mean EXACTLY equals the sum of positive deviations from the mean
|
|
|
What are the formulas for the mean?
|
|
|
|
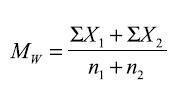
What is the formula for weighted mean?
|
|
|
|
What is a weighted mean?
|
- overall group mean (for more than one group)
-the combined sum divided by the combined n --ie if 5 people average 50%, 10 people average 60%.. weighted mean is (250+600)/(5+10) |
|
|
How would adding, subtracting, multiplying, or dividing each score by a constant change the mean?
|
-adding (or subtracting) a constant from each score changes the mean by THAT constant
-multiplying or dividing by a constant changes the mean in the SAME way |
|
|
What is the mode?
|
-the category or score that has the greatest frequency
-the mode is the NAME of the category, not the frequency (even if the name is a number) -can have more than one mode: 2 is bimodal, 3+ is multimodal |
|
|
Can a distribution have no mode?
|
-yes, if either all the scores are the same or sometimes if there are several scores with equally high frequencies
|
|
|
Can a distribution have two modes that don’t have identical frequencies?
|
-occasionally, if there are two separate and distinct groups (ie up down up)
-taller peak = major mode, shorter peak = minor mode |
|
|
What is the median?
|
-the score that divides the distribution in half so that 50% of the individuals in a distribution have scores at or below the median
-equivalent to the 50th percentile |
|
|
What does the median tell us about the shape of the distribution?
|
-NOTHING
|
|
|
How can mean and median both measure the “middle” of the distribution?
|
-median defines middle in terms of scores (same number of scores below as above)
-mean defines middle in terms of distance (same total distance below as above) |
|
|
What measures of central tendency can you find for nominal scales?
|
mode
|
|
|
What measures of central tendency can you find for ordinal scales?
|
mode and median (NOT mean)
|
|
|
What measures of central tendency can you find for interval scales?
|
all three
|
|
|
What measures of central tendency can you find for ratio scales?
|
all three
|
|
|
In a normally shaped distribution (perfectly symmetrical) what measures of central tendency will always be the same?
|
-all three: mean, median and mode
|
|
|
In a symmetrical distribution, what measures of central tendency will always be the same?
|
-mean and median
|
|
|
What does a normally shaped distribution look like?
|
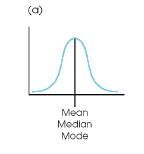
|
|
|
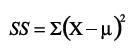
Where would the mean, median, and mode fall (relative to each other) in a skewed distribution?
|
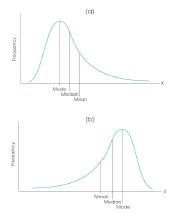
|
|
|
What measure of central tendency is most affected by skew?
|
-mean, because it accounts for ALL scores
|
|
|
in a skewed distribution, the mean is ______________.
|
-pulled toward the tail
|
|
|
What is an outlier?
|
-an extreme score
-lies apart from most of the other distribution -several outliers in a distribution gives a skewed shape -outliers pull some central tendency measures with them |
|
|
What is usually the preferred measure of central tendency (according to text)? Why?
|
-mean
-uses every score in the distribution (typically gives good representative value) -also closely related to variance and standard deviation |
|
|
When do we use a mean? (4 points)
|
-you have interval or ratio data
-the distribution is normally shaped -there is no missing data -the distribution is closed-ended (ie no “3 or more” values) |
|
|
In what situations does the median serve as a valuable alternative to the mean?
|
-extreme scores or skewed distributions (mean can be distorted/displaced)
-undetermined values, ie missing data (mean impossible to determine) -open ended distributions (mean impossible to determine) -ordinal scale (mean not accurate/appropriate because ordinal scales don’t measure distance) |
|
|
In what situations does the mode serve as a valuable alternative to the mean?
|
-nominal scale (mean and median impossible to determine)
-discrete variables (mean is possible, but seems unrealistic if fractional) -describing shape (easy way to help visualize when given along with median or mode) |
|
|
What is variability?
|
-measure of the degree to which scores are spread out or clustered together
|
|
|
What two purposes does a good measure of variability serve?
|
1. Describes the distribution: clustered vs spread out
2. Measures how well an individual score (or group of scores) represents the entire distribution (read: how much error to expect if you are using a sample to represent a population) |
|
|
What are the three measures of variability (that we talk about)?
|
-range, variance, and standard deviation
|
|
|
What is range (in words)?
|
-measure of variability
-the distance between the smallest and largest observations (using RLs if continuous) |
|
|
What kinds of variables can range be calculated for?
|
-interval and ratio (because the concept of distance applies to them)
|
|
|
What is variance (in words)?
|
-a measure of variability
-the average of all squared deviations (distances) from the mean |
|
|
what is standard deviation (in words)?
|
-measure of variability
-rough measure of the average amount by which observations deviate from the mean -square root of the average squared deviation (undoes the squaring) |
|
|
What is the goal of variance and standard deviation?
|
-to measure the typical distance that scores are from the mean
|
|
|
hat do we calculate the range value of variability?
|
continuous: range = URL Xmax – LRLXmin
discrete: count the categories (or largest – smallest + 1) |
|
|
The deviation is the ________ and _________ from the mean.
|
distance (#), direction ( + or -)
|
|
|
What are the steps to finding the standard deviation, in words? (by definition, NOT actual calculation)
|
1. Find the deviation for each individual score
2. Square each deviation score 3. Add the squared deviation scores (SS = sum of squares) 4. Divide sum of squares by number of scores (variance) 5. Find the square root of the variance |
|
|
Why do we need to square each deviation score to find standard deviation?
|
-we want a single number that represents the variability in the distribution, but if we add up all the deviations from the mean, the sum (and thus the mean deviation) would always equal 0
-squaring each deviation score gets rid of the + and – signs, which cancel each other out -result is the mean SQUARED deviation (aka variance) |
|
|
if we sum the deviations from the mean for a given distribution, the total will always ______.
|
equal zero
|
|
|
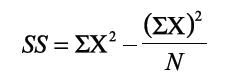
What is Sum of Squares?
|
-SS
-the sum of the squared deviation scores |
|
|
What is the definitional formula of the sum of squares?
|
-direct, but can become complicated if scores aren’t whole numbers
-replace u with M for sample |
|
|
What is the computational formula for the sum of squares?
|
-works with the scores (and not deviations from the mean), so it reduces complications of decimals
-replace N with n for sample |
|
|
What is the variance formula for a population?
|

|
|
|
What is the variance formula for a sample?
|

|
|
|
Why is a sample a biased estimate of a population’s variability? How do we adjust for this bias?
|
-because any sample will be less variable than its parent population
- adjust for this by using n-1 instead of n when calculating sample variance and standard deviation -the effect of this adjustment is to increase the value obtained |
|
|
Why do we use 1 (and not another number) when adjusting for the bias of the sample’s variability compared to the population?
|
-because a sample of n scores has a “degree of freedom” of 1 for the sample variance, which means that while the rest of the scores are independent and free to vary, ONE score is restricted
-for example, if a sample has 3 scores and we know the mean, two of the scores can be ANY number, but the last number must be the exact number that will result in the correct mean |
|
|
How does standard deviation describe variability?
|
-measuring the distance from the mean, accounting for the ends of the distribution and clustering of scores
|
|
|
What is the standard deviation formula for a population?
|

|
|
|
What is the standard deviation formula for a sample?
|
|
|
|
What is the standard deviation formula for a sample?
|

|
|
|
In a graphic representation of the mean and standard deviation, where should the standard deviation line be?
|
-extend approximately halfway from the mean to the most extreme score
|
|
|
What makes a sample statistic biased or unbiased?
|
-biased: if it tends to under or overestimate the corresponding population parameter
-unbiased: if the average value of the statistic is equal to the population parameter |
|
|
Is sample mean a biased or unbiased statistic?
|
-unbiased (best estimate of the population mean)
|
|
|
Is sample variance a biased or unbiased statistic?
|
-unbiased (best estimate of the population variance) ***IF n-1 IS USED***
|
|
|
Is sample standard deviation a biased or unbiased statistic?
|
-biased (tends to UNDERESTIMATE the population standard deviation)
|
|
|
What are the most common values used to describe a set of data?
|
-mean and standard deviation
|
|
|
As a rule of thumb, what percentage of scores will be within 1 standard deviation of the mean? 2 standard deviations?
|
-1: roughly 70%
-2: roughly 95% |
|
|
What happens to standard deviation when you add a constant to each score? Explain.
|
-does not change, there is still the same distance between scores
|
|
|
What happens to standard deviation when you multiply or divide each score by a constant?
|
-changes SD in the same way
|
|
|
Can a sum of squares be negative?
|
No!
|
|
|
What two considerations determine the value of any statistical measurement?
|
1. The measure should provide a stable and reliable description of the scores (not be greatly affected by minor details in the set of data)
2. The measure should have a consistent and predictable relationship with other statistical measurements |
|
|
What factors affect variability?
|
1. Extreme scores
-all measures are affected, but particularly range 2. Sample size -range is directly affected, SD and variance are relatively unaffected 3. Stability under sampling -SD and variance are said to be stable under sampling, range is unstable 4.Open-ended distributions -cannot compute range, SD or variance.. can only use semi-interquartile range (which we don’t discuss!) |
|
|
What is the process of standardizing distributions, in simple terms?
|
-takes different distributions and makes them equivalent (comparable)
|
|
|
What are the benefits of using the mean and standard deviation together?
|
-efficient way to describe a distribution with just two numbers
-allows a direct comparison between distributions that are on the same scales |
|
|
The relative position of an X value within the distribution of scores depends on the distribution’s ____ and ____________.
|
mean, standard deviation
|
|
|
What are raw scores?
|
-the scores that are a direct result of measurement
-they are in the original units of measurement |
|
|
What is the purpose of a z-score?
|
-to identify and describe the exact location of every score in a distribution
-to standardize a distribution (ie lots of tests for IQ, but mean IQ is always 100) --allows direct comparison with other distributions with z-transformed scores |
|
|
What is a Z score?
|
-combines a score, the mean, and the SD into a single number that precisely describes its location relative to the other scores in the distribution
-tells us whether a score is above or below the mean, and by how many standard deviations |
|
|
z-scores are measured in units of ___________.
|
standard deviation
|
|
|
What is the z score formula?
|
|
|
|
What is the formula for finding X from a z score? (ie when you know mean, z-score, and SD)
|
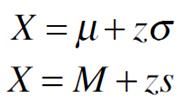
|
|
|
Why does distribution shape stay the same after we standardize (transform to z-scores)?
|
-to find z-scores, we subtract by a constant and divide by a constant
-scores don’t change position, just change units (original become SD) |
|
|
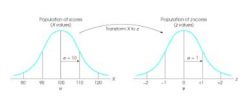
If we transform every X value in a distribution (raw scores) into a z-score, what happens to the shape, mean, and standard deviation?
|
-shape: no change
-mean: becomes 0 -standard deviation and variance: become 1 |
|
|
Why is the mean of any distribution of Z scores zero?
|
-any score equal to the mean is 0 standard deviations away from the mean
-the sum of all positive Zs must equal the sum of all negative Zs |
|
|
The standard deviation of any distribution expressed in z-scores is always ____, which means that the variance is always ____ because...
|
both 1, because the square root of 1 is 1, 1 squared is 1
|
|
|
What is a “standardized distribution”? Used for?
|
- distribution composed of raw scores that have been transformed to create predetermined (known) values for mean and SD
-used to compare distributions across different measures |
|
|
-A z-score distribution is an example of a ____________ distribution.
|
-standardized distribution (mean = 0, SD = 1)
|
|
|
What is the z-score distribution also known as? Why?
|
- the standard normal distribution
-because it is a normal distribution expressed in standard (Z) scores (mean = 0, SD = 1) |
|
|
How do we transform z-scores to a distribution of our choice?
|
1. transform your raw scores into z scores
2. Transform z scores into the new distribution using the formula Xnew = μ(new) + zσ(new) |
|
|
What are representative and extreme z scores, according to the textbook?
|
-representative/central = close to the mean (within one SD?)
-extreme = 2 or more SD’s away from the mean |