![]()
![]()
![]()
Use LEFT and RIGHT arrow keys to navigate between flashcards;
Use UP and DOWN arrow keys to flip the card;
H to show hint;
A reads text to speech;
62 Cards in this Set
- Front
- Back
|
Population |

All involved in a particular experiment or study. |
|
|
Sample |

A small section or group of the population in an experiment or study |
|
|
Observational Study |

A study based solely on observations as contrary to an experiment |
|
|
Designed Experiment |
A method of getting data from exposing a controlled group to a specific scenario. |
|
|
Confounding Variable |

An unforseen event in an experiment. |
|
|
Simple Random Sample |
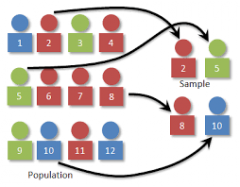
As it sounds, a random selection of a small group of subjects. |
|
|
Census |

A survey of the entire population.
|
|
|
Representative Sample |

A sample that represents the population.
|
|
|
Bias |

Prejudice in favour of one side of the "story." |
|
|
Systematic Sampling |
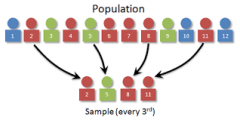
A systematic method of choosing subjects for a sample. |
|
|
Cluster Sampling |
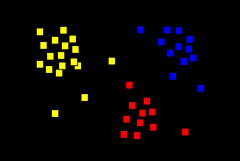
Sampling based on clusters.
|
|
|
Stratified Sampling |
Sampling based on strata. |
|
|
Control |

A group that is not exposed to the treatment being used in an experiment.
|
|
|
Randomization |
The act of randomizing.
|
|
|
Replication |

The recreation of an event. |
|
|
Placebo |
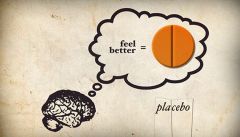
A psychological reaction to an imposed treatment with no medical effects. |
|
|
Explanatory Variable |

The variable that explains the whole issue.
|
|
|
Factor |
A piece of something much larger.
|
|
|
Levels |

The different elevations of seperate pieces.
|
|
|
Treatments |

The changing qualities in experimental groups which make them experimental.
|
|
|
Feasibility Study |

A study to test the feasibility of something.
|
|
|
Market Research Analyst |

A nerd.
|
|
|
Qualitative Variable |

A variable only dealing with the qualities of a subject.
|
|
|
Discrete Quantitative Variable |

A set number to explain the quantity of something.
|
|
|
Continuous Quantitative Variable |
A continuous number to explain a certain quantity. |
|
|
Frequency Distribution |
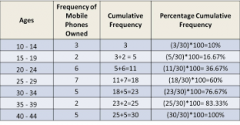
A table showing the distribution of frequency.
|
|
|
Relative Frequency |
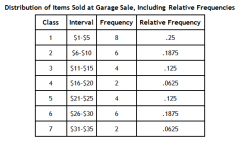
A table showing the ratio of the the frequency to the total.
|
|
|
Pie Chart |
A chart that explains percentages and appropriately looks similar to a pie.
|
|
|
Bar Chart |
A chart showing frequencies appropriately looking similar to a series of bars.
|
|
|
Histogram |
A graph showing relative frequency.
|
|
|
Dot Plot |

A plot of dots
|
|
|
Stem-and-Leaf Plot |
A graph showing values as raw data appropriately looking like a stem with leaves sprouting therefrom.
|
|
|
Mean |

The average of a set of data.
|
|
|
Median |
The middle value.
|
|
|
Mode |
The data point that occurs most often in a set of data.
|
|
|
Scatterplot |
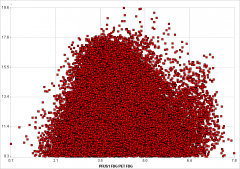
A bivariate plot that appropriately looks like a scatter of non-sense.
|
|
|
Bivariate Data |
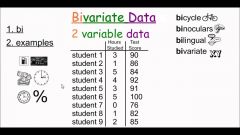
Data with two variables.
|
|
|
Interquartile Range |
The range of the first and third quartile in a set of data.
|
|
|
Point Estimate |
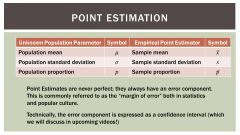
A single point that gives an estimate of the parameter of the population.
|
|
|
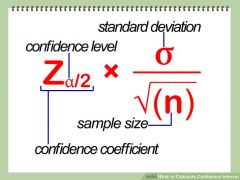
Confidence Interval |
[Insert Confidence Interval equation here] |
|
|
Confidence Interval Estimate |
Estimate of the confidence interval.
|
|
|
Sampling Distribution |
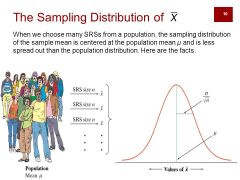
A probability distribution of many samples.
|
|
|
Central Limit Theorem |
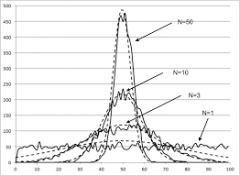
Paraphrased: "Yo' data gon' be shaped like a bell, yo." |
|
|
True Mean |

The average of the population.
|
|
|
Margin of Error |
The possible length from the point estimate that you can be a specific percentage is true.
|
|
|
Experimental Probability |
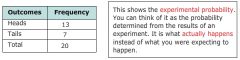
The probability of an outcome based on experiments.
|
|
|
Theoretical Probability |
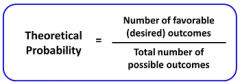
The probability of an outcome based on theory.
|
|
|
Independent Events |

Events that are uneffected by others. |
|
|
Dependent Events |

Events that are effected by others.
|
|
|
Probability of two or more events |
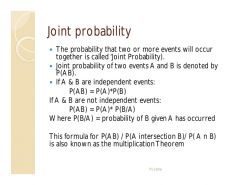
Picture says it all.
|
|
|
Probability Notation |
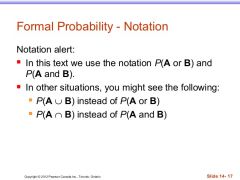
The notation in which probability is written.
|
|
|
Basic Counting rule |

When there are m ways of doing something and n ways of doing something else, then there are mxn ways of doing both.
|
|
|
Permutation |
A possible outcome in which order can change. |
|
|
Combination
|
A possible outcome in which any given order is unimportant as long as all pieces are present.
|
|
|
Contingency Tables |
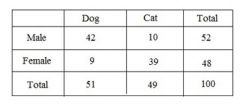
Tables showing all possible outcomes, but are impossible to be certain of.
|
|
|
Sample Space |
All possible outcomes. |
|
|
Random Variable |

A RANDOM variable. |
|
|
Probability Distribution |
A distribution of probabilities based on possible outcomes. |
|
|
Probability Histogram |
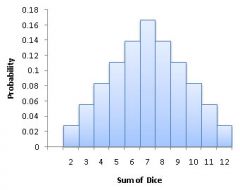
A histogram based on a probabilitiy distribution.
|
|
|
Bernoulli Trials |

Trials to be run based on studies by Bernoulli.
|
|
|
Binomial Probability Formula |
PICTURE |
|
|
Expected Value (Mean of a Discrete Random Variable) |
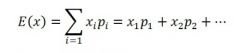
The expected value if more trials were run.
|