![]()
![]()
![]()
Use LEFT and RIGHT arrow keys to navigate between flashcards;
Use UP and DOWN arrow keys to flip the card;
H to show hint;
A reads text to speech;
22 Cards in this Set
- Front
- Back
|
Gross Margin Percentage |

|
|
|
Gross Margin |

|
|
|
Earnings per Share |
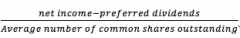
Note: net income for common stockholders = net income – dividends paid to preferred stock holders. |
|
|
Price-Earnings Ratio |
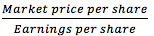
Note: With a high P – E ratio, investors are willing to pay a premium for the company’s stock (they expect the company to grow) |
|
|
Dividend Yield Ratio |
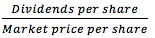
Note: Measures the rate of return (in the form of cash dividends only) that would be earned by an investor who buys common stock at the current market price. |
|
|
Return on Total Assets |
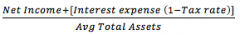
Note: interest expenses are added back to the net income to show what earnings would have been if the company had not debt. (this allows comparison of companies with and without debt) |
|
|
Return on Equity |
Net Income _____________ Average Stockholder's Equity |
|
|
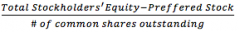
Book Value per Share |
|
|
|
Working Capital |

|
|
|
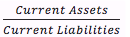
Current Ratio |
|
|
|
Acid- Test (quick) Ratio |

|
|
|
Accounts Receivable Turnover |
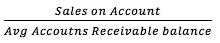
Note: measures how quickly sales are converted into cash. |
|
|
Average Collection Period |
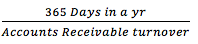
Note: whether this measurement is or good bad depends on the credit terms your firm is offering its customers. If credit terms are 30 days, then 35 avg C.P. would usually be viewed as good. |
|
|
Inventory Turnover |
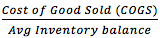
Note: measures how many times a company’s inventory has been sold and replaced during the year.
|
|
|
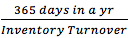
Average Sale Period
|
|
|
|
Times Interest Earned Ratio |
Earnings before Tax and Interest Expense ___________________________________________ Interest Expense+ |
|
|
Debt-to-Equity Ratio |
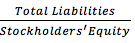
Note: Creditors like to see less debt and more equity because equity represents the excess of total assets over total liabilities and means a better buffer for them.
|
|
|
Operating Cycle |
Average Sale Period ________________________ Average collection period |
|
|
Total Asset Turnover |
Sales/Average total Assets |
|
|
Equity Multiplier |
Average total Assets/Average stockholder's equity |
|
|
Net Profit Margin Percentage |
Net income/Sales |
|
|
Dividend Payout Ratio |
Dividends per Share/Earnings per share |