![]()
![]()
![]()
Use LEFT and RIGHT arrow keys to navigate between flashcards;
Use UP and DOWN arrow keys to flip the card;
H to show hint;
A reads text to speech;
109 Cards in this Set
- Front
- Back
|
short-run fluctuations in output and employment |
business cycle |
|
|
ending date of a recession |
business cycle trough |
|
|
starting date of a recession |
business cycle peak |
|
|
for every percentage point the unemployment rate rises, real gdp growth falls by |
2% |
|
|
when unemployment rate rises from 5 to 7 percent, percentage change in real GDP= |
3% - 2x(7%-5%) |
|
|
average workweek length, average claims for UI, new orders for consumer goods, new orders for nondefense capital goods |
leading indicators |
|
|
index of supplier deliveries, new building permits issued, index of stock prices, M2 growth adjusted for inflation, interest rate spread, index of consumer expectations |
leading indicators |
|
|
irrelevance of the money supply for the determination of real variables |
monetary neutrality |
|
|
relationship between the quantity of output |
aggregate demand |
|
|
the quantity of goods and services people want to buy at any given |
aggregate demand |
|

|
k is 1/V, states that supply of real money balances (m/p) equals demand for real money |
|
|
left axis of AD curve ___, right axis of AD curve _ |
price level, income/output/Y |
|
|
Why does the AD curve slope downward |
When M and V are fixed if P goes up Y must go down by the equality -- intuition is that price level rising means each transaction requires more dollars such that quantity purchased must fall |
|
|
is the relationship between the quantity of goods |
aggregate supply |
|
|
the Long run aggregate supply is _______ |
vertical because output does not depend on the price level |
|
|
LRAS is fixed at the _____ level of output |
natural or full-employment |
|
|
policy actions aimed at reducing the severity of short-run economic fluctuations. |
stabilization policy |
|
|
introduction of credit cards has what effect on aggregate demand? |
reduce quantity of money people hold, which increases velocity, decreasing parameter k, thus aggregate demand shifts outward |
|
|
union aggressiveness, environmental regulation, oil cartels, drought |
adverse supply shocks |
|
|
government debt does not influence national |
recardian equivalence |
|
|
causes of deficit |
age composition, rising healthcare costs |
|
|
The budget deficit includes the change in debt as a result of |
inflation, (pi)D is extent of over-statement of debt |
|
|
measurement problems of debt/deficit |
inflation, capital assets, uncounted liabilities, business cycle |
|
|
capital asset problem of gov. debt? |
the budget deficit should be measured as the change in debt minus the change in assets. |
|
|
A budget procedure that accounts for assets as well as liabilities |
capital budgeting |
|
|
implicit debt not counted in deficit includes |
pensions, Social security |
|
|
the liability that is due only if student loans, low- and moderate-income families, and deposits in banks and savings in loan institutions are defaulted |
contingent |
|
|
TARP, how it worked |
The Treasury borrowed money, gave the |
|
|
based on estimates of what government spending and tax revenue would be if the economy were operating at its natural level of output and employment |
cyclically adjusted budget deficit |
|
|
base their spending decisions not only on their |
forward-looking Ricardian consumer |
|
|
reasons against Ricardian consumer |
myopia, future generations, and borrowing constraints |
|
|
why deficit or surplus is okay? |
stabilization of business cycle, tax smoothing, intergenerational redistribution |
|
|
benefits of indexed bonds |
less inflation risk, more financial innovation, better government incentives, |
|
|
stimulates consumer spending and lowers national saving. This increase in consumer spending leads to greater aggregate demand and |
traditional view of government debt |
|
|
a debt-financed tax cut does not stimulate consumer spending because it does not raise |
ricardian view of government debt |
|
|
cyclical low income and high unemployment caused by what according to Keynes |
aggregate demand |
|
|
LM stands for ________ and represents what's happening to _____________ |
liquidity and money, supply and demand for money |
|
|
measures amount firms households and government spend on goods and services, equals GDP |
actual expenduture |
|
|
amount firms households and government would like to spend on goods and services |
planned expenditure |
|
|
planned expenditure is a function of _ _ _ _ |
C(Y-t), I G |
|
|
slope of the planned expenditure function |
marginal compensity to consume |
|
|
Keynesian cross assumes that _________ |
economy is in equilibrium when actual expenditure equals planned expenditure because when people's plans are realized they have no reason to change what they're doing. |
|
|
assumption of Keynesian cross that actual expenditure equals planned expenditure holds when _______________ |
45 degree line intersection with Planned Expenditure function |
|
|
to the right of intersection of Keynesian cross |
unplanned inventory accumulation causes income to fall because firm accumulation of inventory induces firms to decrease production |
|
|
to the left of intersection of Keynesian cross |
unplanned drop in inventory causes income to rise because firms increase production |
|
|
the ratio change in Y to change in G (dY/dG), measures how much income rises with a $1 increase in G |
government purchases multiplier |
|
|
why does fiscal policy have a multiplied effect on income? |
in consumption function c(Y-T) higher income causes higher consumption --- eg dG+MPC.G+MPC(MPC.G)+.... feedback effect |
|
|
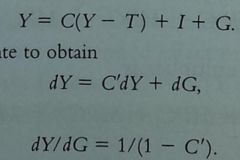
government purchases multiplier = |
dY/dG=1+MPC+MPC^2+MPC^3... = 1/(1-MPC) |
|
|
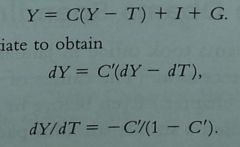
tax multiplier + |
-MPC / (1 - MPC) |
|
|
things that shift the PE curve up ... |
decrease in taxes, increase in G |
|
|
derivation of the tax multiplier |
|
|
derivation of government purchases multiplier |
|
|
argue that economic boom resulted from incentive effects to work more from the income tax cut |
supply siders |
|
|
why is increasing G better than decreasing T |
government purchases multiplier exceeds tax multiplier because some of tax cut will be saved |
|
|
the cost of borrowing |
interest rate |
|
|
slope of the interest rate is __________ the y is __ and the x is ______ |
negative because it's the cost of borrowing, r, I |
|
|
an increase in the interest rate causes planned invetment to fall which in turn causes equilibrium income to fall means that |
IS curve slopes downward |
|
|
fiscal policy only refers to changes in |
G and T |
|
|
changes in G and T affect IS curve by _____ |
shifting planned expenditure |
|
|
plots the relationship between the interest rate and the level of income that arises in the market for money balances |
LM curve |
|
|
the interest rate adjusts to balance the supply and demand for the economy's most liquid asset - money |
theory of liquidity preference |
|
|
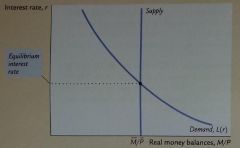
what's the assumption of the theory of liquidity preference |
fixed supply of real money balances |
|
|
real money balances supply is vertical because money supply is exogenous or doesnt depend on the interest rate |
|
|
demand for money curve is negative because |
a higher interest rate raises the cost of holding money and thus lowers quantity demanded |
|
|
money market disequilibrium what's actually happening |
interest rate altered because people adjust the portfolios of their assets |
|
|
individuals holding excess supply of money try to convert their cash into interest-bearing deposits and banks subsequently lower their interest rates so they dont have to pay as much |
interest rate is above equilibrium level |
|
|
people sell bonds and make withdrawals, banks have scarce funds and respond by increasing their interest rates |
r is below equilibrium or quantity of money demanded exceeds quantity supplied |
|
|
decrease in the money supply ________ the interest rate |
raises |
|
|
The quantity of real money balances demanded is ______________ related to the interest rate and ________________ related to income |
negatively, positively |
|
|
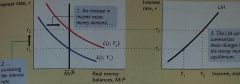
LM loin from L(r,Y) and M/P |
|
|
why is the LM upward sloping |
higher income leads higher demand for real money balances leads to a higher interest rate |
|
|
an increase in the money supply lowers the interest rate which stimulates investment and thereby expands the demand for goods and services |
monetary transmission mechanism |
|
|
the fed can offset the recession caused by a tax hike if it |
expands the money supply at the expense of a large decrease in the interest rate |
|
|
SRAS equation |
Y=Ybar +a(p-ep) |
|
|
output deviates from its natural level when |
price level deviates from the expected price level |
|
|
slope of the aggregate supply curve |
1/a |
|
|
two reasons why aggregate supply slopes upward |
when prices are higher firms need to charge more to recoup costs, the imperfect information model |
|
|
all prices are free to adjust to balance supply and demand but short run and long run supply curves differ because of temporary misperceptions about prices |
imperfect information model |
|
|
when actual prices exceed expected prices, suppliers raise their output |
imperfect information model |
|
|
phillips curve |
pi = Epi - B(u-u^n) +v |
|
|
people form their expectations of inflation based on recently observed inflation |
adaptive expectations |
|
|
pi - pi(last year) - B (u-u^0)+v |
non accelerating inflation rate of unemployment NAIRU |
|
|
low employment pulls the inflation rate up; high aggregate demand is responsible --- high unemployment pulls the inflation rate down -- B |
demand-pull inflation |
|
|
v term in phillips curve. adverse supply shocks mean positive v |
cost-push inflation |
|
|
percentage of a year's real GDP that must be forgone to reduce inflation by 1 percentage point |
sacrifice ratio |
|
|
reducing inflation by 1 percentage point requires sacrifice of ______ of cyclical unemployment |
2.5 |
|
|
fluctuations in aggregate demand affect output and employment only in the short run |
natural rate hypothesis |
|
|
long-lasting influence of history on the natural rate of unemployment |
hysteresis |
|
|
time between a shock to the economy and the policy action responding to that shock; occurs because it takes time for policy makers to recognize that a shock has occurred |
inside lag |
|
|
time between a policy action and its influence on the economy because policies do not immediately affect anything |
outside lag |
|
|
which has the worse inside lag between fiscal and monetary policy |
fiscal |
|
|
income taxes, Unemployment insurance, welfare |
automatic stabilizers |
|
|
traditional methods of policy evaluation do not take into account the impact of policy on expectations |
lucas critique |
|
|
Lucas thoughts on disinflation and sacrifice ratio |
estimates of the sacrifice ratio are unreliable because they do not consider how policy affects expectations; reducing inflation can be less costly |
|
|
according to romer why hasn't keynesianism worked after 30s |
figment of the data; making "bad" modern data and good old data shows the disparity in data-gathering |
|
|
manipulation of the econoy for electoral gain |
political business cycle |
|
|
policymakers can sometimes better achieve their goals by having their discretion taken away from them because of |
time inconsistency of policy |
|
|
advocate rule where the Fed keeps money growing at a steady rate; doesn't allow adjustment for shocks |
monetarists |
|
|
fed announces planned path for nominal GDP and reduces or increase money growth to affect AD |
GDP targeting rule |
|
|
money supply adjustment that insulates economy from changes in velocity of money |
inflation targeting rule |
|
|
when inflation rises, the federal funds rate should _______, meaning smaller money supply |
rise |
|
|
responds to inflation and the output gap (as a measure of inflationary pressure) |
taylor rule |
|
|
increase in the money supply lowers interest rate, stimulating investment and expanding the demand for goods and services; how monetary expansion induces greater spending |
monetary transmission mechanism |
|
|
interest rate that banks charge one another for overnight loans |
federal funds rate |
|
|
hypothesis placing primary blame for the depression on an exogenous fall in spending on goods and services, thus a contractionary shift in the IS curve |
spending hypothesis |
|
|
places blame on the federal reserve for allowing the money supply to fall |
money hypothesis |
|
|
mechanism by which falling prices expand real money balances, making consumers spend more |
pigou effect |
|
|
unexpected falls in the price level enriches creditors and impoverishes debtors, affecting spending on goods and services because debtors probably have higher propensities to consume |
debt-deflation theory |
|
|
interest rates have fallen so low that monetary policy is no longer effective |
liquidity trap |