![]()
![]()
![]()
Use LEFT and RIGHT arrow keys to navigate between flashcards;
Use UP and DOWN arrow keys to flip the card;
H to show hint;
A reads text to speech;
15 Cards in this Set
- Front
- Back
|
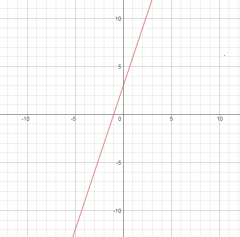
y=3x+3 What is the slope of this line? |
|
|
|
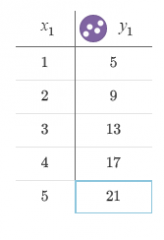
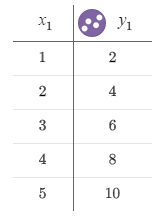
y=4x+1 What are the points in this equation?
|
|
|
|
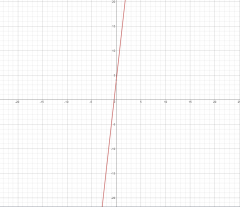
y=9x+4 Would the slope of this line be steep? |
|
|
|
y=I2xI How do you solve for the value of x?
|
|
|
|
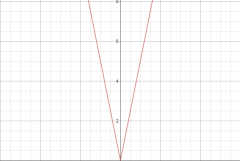
y=I5xI What does the graphs slope look like? |
|
|
|
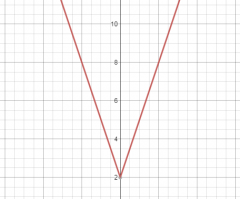
y=I3xI+2 what is the y intercept of this graph? |
|
|
|
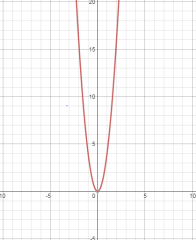
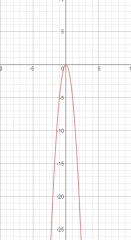
y=4x2 Why is the graph in a U shape |
|
|
|
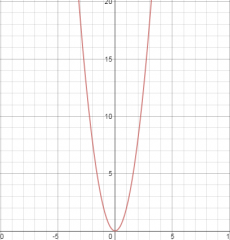
what kind of graph is this based on the graph? |
|
|
|
What happens to the graph if the equation is negative? |
It is also a reflection |
|
|
How do you find range in a box plot? |
You subtract the lower quartile from the upper quartile |
|
|
Where would the median be on a box and whisker plot |
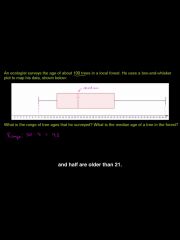
it is in the middle of the box plot. |
|
|
How do you find the median of a box plot |
You find the middle number of the set of numbers given to you. |
|
|
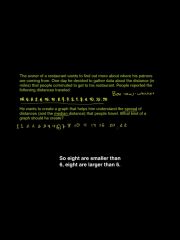
How do you find the IQR for a box and whisker plot |
you have to find the lower and upper quartile. Then subtract the lower quartile from the upper quartile. Then multiply that by 1.5. Example- 1,2,3,4,6,7,7,7,8,9 7-3=4 4x1.5=6 IQR=6 |
|
|
What is the minimum and the maximum on a box plot? |
It is the lowest and highest number. Example- 44,76,85,93,100,101,200 Minimum=44 Maximum= 200 |
|
|
How many intervals can a histogram have? |
You can have 6-12 |