![]()
![]()
![]()
Use LEFT and RIGHT arrow keys to navigate between flashcards;
Use UP and DOWN arrow keys to flip the card;
H to show hint;
A reads text to speech;
424 Cards in this Set
- Front
- Back
|
real-time data warehousing |
active data warehouse (ADW) |
|
|
integration that comprises three major processes: data access, data federation, and change capture |
Data integration |
|
|
a departmental data warehouse that stores only relevant data |
data mart |
|
|
a physical repository where relational data are specifically organized to provide enterprise-wide, cleansed data in a standardized format |
data warehouse (DW) |
|
|
a person responsible for the administration and management of a data warehouse |
Data warehouse Administrator |
|
|
a subset that is created directly from a data warehouse |
dependent data mart |
|
|
a retrieval -based system that supports high-volume query access |
dimensional modeling |
|
|
the investigation of information in detail. Finding the detailed sources |
drill down |
|
|
a technology that provides a vehicle for pushing data from source systems into a data warehouse |
enterprise application integration |
|
|
an organizational-level data warehouse developed for analytical purposes |
enterprise data warehouse (EDW) |
|
|
an evolving tool space that promises real-time data integration from a variety of sources, such as relational databases, Web services, and multimensional databases |
Enterprise information integration (EII) |
|
|
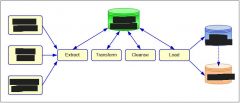
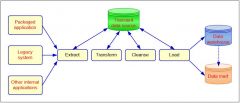
a data warehousing process that consists of reading data from a data base, converting the data from its previous form into the form in which it needs to be so that it can be placed into a data warehouse or simply another database, and putting the data into the data warehouse |
Extraction, Transformation, and Load (ETL) |
|
|
a small data warehouse designed for a strategic business unit or a department |
Independent data mart |
|
|
data about data |
metadata |
|
|
an information system that is primarily responsible for capturing and storing data related to day-to-day business functions |
OLTP |
|
|
a small scale data mart typically used by a single department or functional area in an organization |
oper mart |
|
|
a type of database often used as an interim area for a data warehouse, especially for customer information files |
operational data store (ODS) |
|
|
the process of loading and providing data via a data warehouse as they become available |
real-time data warehouse (RDW) |
|
|
a logical arrangement of tables in a multidimensional database in such a way that the entity relationship diagram resembles a snowflake in shape |
snowflake schema |
|
|
most commonly used and simplest style of dimensional modeling |
star schema |
|
|
a subset of highly interrelated data that is organized to allow users to combine any attributes with any metrics to create various two-dimensional views, or slices, that can be displayed on a computer screen |
Cube |
|
|
a performance measurement and mangement methodology that helps translate an organization's financial, customer, internal process, and learning and growth objectives and targets into a set of actionable initiatives |
balanced scorecard (BSC) |
|
|
an advanced performance measurement and analysis approach that embraces planning and strategy |
business performance management (BPM) |
|
|
a visual presentation of critical data for executives to view |
dashboards |
|
|
a graphical, animation, or video presentation of data and the results of data analysis |
data visualization |
|
|
a closed-loop business improvement model that includes 5 steps |
D(efining)M(eauring)A(nalyzing)I(mproving)C(ontrolling) |
|
|
measure of performance against a strategic objective and goal |
key performance indicator (KPI) |
|
|
a process of self-improvement where the new knowledge is obtained through a process by using what is already known |
learning |
|
|
systematic methods of selecting business goals together with periodic, feedback reports that indicate progress against goals |
performance measurement systems |
|
|
any communication artifact prepared with the specific intention of conveying information in a presentable form |
report |
|
|
a performance management methodology aimed at reducing the number of defects in a business process to as close to zero defects per million opportunities as possible |
Six Sigma |
|
|
Read 2.1 (2) |
Do it. |
|
|
Read Opening Vignette Chapter 2 (1) |
Do it. |
|
|
Read 2.2 (3) |
Do it. |
|
|
Read 2.3 (4) |
Do it. |
|
|
Read 2.4 (5) |
Do it. |
|
|
Read 2.5 (6) |
Do it. |
|
|
Read 2.6 (7) |
Do it. |
|
|
Read Opening Vignette Chapter 3 (8) |
Do it. |
|
|
Read 3.1 (9) |
Do it. |
|
|
Read 3.2 (10) |
Do it. |
|
|
Read 3.3 (11) |
Do it. |
|
|
Read 3.4 (12) |
Do it. |
|
|
Read 3.6 (13) |
do it |
|
|
Read 3.7 (14) |
Do it. |
|
|
Read 3.8 (15) |
Do it. |
|
|
Watch Enterprise (16). |
Do it. |
|
|
A ____ _________ is a specially constructed data repository where data are organized so that they can be ______ ________ by end users for _______ ____________. |
data warehouse easily accessed several applications |
|
|
Data marts contain data on ___ _____ (e.g. marketing). A data mart can be a ___________ of a ______ of data in the data warehouse. Data marts are a _____ _________ solution that can be replaced by or can supplement a data warehouse. Data marts can be __________ of or _________ on a data warehouse. |
one topic replication of a subset less expensive independent dependent |
|
|
An ODS is a type of ________-___________-____ database that is often used as a ____________ for a data warehouse |
customer-information-file staging area |
|
|
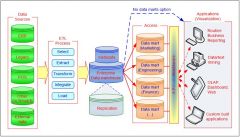
Data integration comprises three major processes: ____ ______, ____ __________, and ______ _______. When these three processes are correctly implemented, data can be accessed and made accessible to an array of ___ and ________ tools and ____ ___________ environments. |
data access data federation change capture ETL analysis data warehousing |
|
|
ETL technologies ____ ____ from many sources, _______ them, and ____ them into a data warehouse. ETL is an ________ process in any data centric project. |
pull data cleanse load integral |
|
|
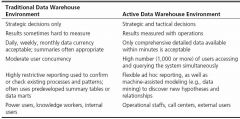
Real-time or ______ ____ warehousing supplements and expands traditional data warehousing, moving into the realm of ___________ and ________ decision making by _______ data in ____ ____ and providing data to users for active decision making |
active data operational tactical loading real-time |
|
|
The security and privacy of data and information are ________ ______ for a data warehouse professional. |
critical issues |
|
|
A report is any _____________ artifact prepared with the specific intention of _________ ___________ in a presentable form. |
communication conveying information |
|
|
A business report is a _______ ________ that contains information regarding ________ matters. |
written document business |
|
|
The key to any successful business report is _______, _______, ____________, and ___________. |
clarity brevity completeness correctness |
|
|
Data visualization is the use of visual representations to _______, ____ _______ of and ___________ data. |
explore make sense communicate |
|
|
Basic chart types include ____, ___, and ___ chart. |
line bar pie |
|
|
___________ ______ are often derived from the basic charts as exceptional cases |
Specialized charts |
|
|
____ _____________ __________ and tools make the users of business analytics and business intelligence systems better information consumers. |
Data Visualization Techniques |
|
|
Visual analytics is the combination of _____________ and ____________ ____________. |
visualization predictive analytics |
|
|
__________ _____ for visual analytics coupled with ____-_______ ____ ________ led to exponential growth in highly efficient visualization systems investment. |
Increasing demand Fast-growing data volumes |
|
|
Dashboards provide ______ ________ of important information that is ____________ and arranged on a ______ screen so that information can be digested at a ______ glance and ______ drilled in and further explored. |
visual displays consolidated single single easily |
|
|
BPM refers to the _________, _____________, _______, and ___________ used by enterprises to _______, _______, and ______ business performance. |
processes methodologies metrics technologies measure monitor manage |
|
|
BPM is an _________ of BI, and it incorporates many of its ____________, ____________, and __________. |
outgrowth technologies application techniques |
|
|
The primary difference between BI and BPM is that BPM is ______ ________ ______. |
always strategy driven |
|
|
BPM encompasses a ______-____ set of processes that link ________ to _________ in order to optimize business performance. |
closed-loop strategy to execution |
|
|
The key processes in BPM are __________, ____, _______, ___, and ______. |
strategize plan monitor act adjust |
|
|
What question does strategy answer? |
Where do we want to go in the future? |
|
|
Decades of research highlight the ___ between strategy and execution. |
gap |
|
|
The gap between strategy and execution is found in the broad areas of _____________, _________, _____, and _________. |
communication alignment focus resources |
|
|
What question do operational and tactical plans address? |
How do we get to the future? |
|
|
An organization's _________ __________ and ___ ______ should serve as top-down drivers for the allocation of the organization's tangible and intangible assets. |
strategic objectives key metrics |
|
|
Monitoring addresses the question of... |
How are we doing? |
|
|
The overall impact of the planning and reporting practices of the average company is that management has little time to ______ ________ from a strategic perspective, ______ what should be done ___________, and ___ __ the revised plans. |
review results decide differently act on |
|
|
The drawbacks of using _________ ____ as the core of a performance measurement system are well know. |
financial data |
|
|
Performance measures need to be derived from the _________ and ________ unit strategies and from an analysis of the key business processes required to achieve those strategies. |
corporate business |
|
|
Probably the best-known and most widely used performance management system is the ___ |
BSC |
|
|
Central to the BSC methodology is a holistic vision of a ___________ ______ tied to the _________ _________ of the organization. |
measurement system strategic direction |
|
|
As a measurement methodology, BSC is designed to ________ the limitations of systems that are ___________ focused. |
overcome financially |
|
|
As a strategic management methodology, BSC enables an organization to... |
align its actions with its overall strategies |
|
|
In BSC, strategy maps provide a way to formally represent an organization's _________ __________ and the ______ ___________ among them. |
strategic objectives causal connections |
|
|
Most companies use ___ _____ as a process improvement methodology that enables them to __________ their _________, ________ ________, and apply ________. |
Six Sigma scrutinize their processes pinpoint problems remedies |
|
|
Six Sigma is a performance management methodology aimed at ________ the number of defects in a business process to as close to ____ ____ as possible. |
reducing zero DPMO |
|
|
Six Sigma uses _____, a closed-loop business improvement model that involves the steps of ________, _________, _________, ________, and __________ a process |
DMAIC defining measuring analyzing improving controlling |
|
|
Substantial performance benefits can be gained by ___________ ___ and ___ _____. |
integrative BSC Six Sigma |
|
|
Five major BPM applications |
strategy management budgeting, planning, and forecasting financial consolidation profitability analysis and optimization financial, statutory, and management reporting |
|
|
Over the past 3 to 4 years, the biggest change in the BPM market has been the _____________ of BPM vendors. |
consolidation |
|
|
Which approach is Kimball? |
Data Mart |
|
|
Which approach is Inmon? |
EDW |
|
|
Data Mart vs. EDW approach (9) |
1. Data mart is one subject area, while EDW is several 2. The development for Data Mart takes months, while EDW takes years. 3. The development cost for Data Mart is significantly lower 4. The development difficulty for Data Mart is less 5. The data prerequisite for sharing is common (within business area) for data mart and common (across enterprise for EDW) 6. EDW is bigger 7. Number of simultaneous users is much larger for EDW 8. Data transformations is lower for Data Mart 9. User types for Data mart are business area analysts and managers, while for EDW they are executive analysts and senior executives |
|
|
The inmon model: The edw approach is... |
top-down |
|
|
The Kimball Model: the data mart approach is to... |
plan big, build small; bottom-up |
|
|
Data Mart approach eventually leads to ___ |
EDW |
|
|
Using a hosted data warehouse is kind of like... |
having a landlord. |
|
|
Seven benefits for using a hosted data warehouse |
1. requires minimal investment in infrastructure 2. frees up capacity on in-house systems 3. frees up cash flow (pay as you use) 4. makes powerful solutions afforable 5. enables powerful solutions that provide for growth 6. offers better quality equipment and software 7. provides faster connectoins |
|
|
Con for using an outsourced data warehouse |
reasons of security and privacy |
|
|
Business logic is the explicit steps for how the recorded transactions/events are to be converted into _______, __________, and __________. |
metrics scorecards dashboards |
|
|
Publication is the system that ______ the various reports and _____ them (for users) or _____________ them (to users). |
builds hosts disseminates |
|
|
Assurance is making sure that the _____ information gets to the _____ people in the _____ format. |
right right right |
|
|
Data visualization is closely related to these four fields: |
1. information graphics 2. information visualization 3. scientific visualization 4. statistical graphics |
|
|
Two old components of data visualization |
charts and graphs |
|
|
Two new components of data visualization |
scorecards and dashboards |
|
|
most frequently used graphical visuals for time series data |
line charts |
|
|
Examples of line charts (2) |
1. changes on a specific stock price over a 5-year period 2. changes on the number of daily customer service calls over a month |
|
|
among the most basic visuals used for data representation |
bar charts |
|
|
when are bar charts effective? |
when you have nominal or numerical data that splits nicely |
|
|
Why are bar charts effective? |
you can quickly see comparative results and trends within your data. |
|
|
example for bar chart |
percent of advertising spending by departments or by product categories |
|
|
Pie charts should NOT be used if... |
the number of categories is very large |
|
|
visually appealing |
pie charts |
|
|
illustrate relative proportions of a specific measure |
pie charts |
|
|
If there are a large number of categories, instead of using a pie chart, you should... |
use a bar chart |
|
|
example of pie charts |
relative proportions of majors declared by college students in their sophomore year |
|
|
often used to explore the relationship between two or three variables |
scatter plot |
|
|
example of scatter plot |
co-relationship between age and weight of heart disease patients |
|
|
often enhanced versions of scatter plots |
bubble chart |
|
|
How can one add additional dimensions in bubble charts? |
by varying the size and/or color of the circles |
|
|
example for bubble charts |
college-level class attendance by major and by time of the day |
|
|
used to show the frequency distribution of a variable or several variables |
histogram |
|
|
What does the x-axis usually show in a histogram? |
categories or ranges |
|
|
what does the y-axis usually show in a histogram? |
measures/values/frequencies |
|
|
show the distributional shape of the data |
histograms |
|
|
What can you examine about the data in a histogram? |
if the data is normally or exponentially distributed |
|
|
special case of horizontal bar charts |
GANTT Chart |
|
|
what are gantt charts used for? |
to portray project timelines, project tasks/activity durations, and overlap amongst the tasks/activities |
|
|
also called network diagrams |
Pert chart |
|
|
developed primarily to simplify the planning and scheduling of large and complex projects |
Pert charts |
|
|
What kind of relationships do Pert charts show? Between what? |
precedence relationships among the project activities/tasks |
|
|
the data on a map |
geographic map |
|
|
illustrate the comparison of continuous values across two categories using color |
heat map |
|
|
What does a heat map help readers quickly see? |
the categories that are strongest and weakest in terms of numerical values of the measure being analyzed |
|
|
hierarchial data as a set of rectangles |
tree map |
|
|
How does a tree map work? |
Each branch of the tree is given a rectangle, which is then tiled with smaller rectangles presenting sub-branches. |
|
|
leading information technology research and advisory company |
Gartner |
|
|
Magic Quadrant was created by who and why? |
Gartner; to monitor and evaluate the progress and positions of companies in a specific, technology based market. |
|
|
What does Magic Quadrant do? |
helps users to understand how technology providers are positioned within a market |
|
|
How does Magic Quadrant achieve its goal? |
By applying a graphical treatment and a uniform set of evaluation criteria. |
|
|
What are most organizations trying to do? |
mature their visualization capabilities and to move from descriptive to diagnostic analytics |
|
|
What is a data warehouse? |
a physical repository where relational data are specially organized to provide enterprise-wide, cleansed data in a standardized format |
|
|
pool of data |
data warehouse |
|
|
The data warehouse is a collection of __________, _______-________ databases designed to support DSS functions, where each unit of data is ___-________ and _________ to some moment in time. |
integrated subject-oriented non-volatile relevant |
|
|
Eight characteristics of Data Warehouses |
1. subject oriented 2. integrated 3. time-variant 4. nonvolatile 5. summarized 6. metadata 7. web based, relational/multi-dimensioned 8. client/server, real-time |
|
|
a departmental, small-scale DW that stores only limited/relevant data |
Data mart |
|
|
a small subset that is created directly from a data warehouse |
dependent data mart |
|
|
a small data warehouse designed for a strategic business unit or a department |
independent data mart |
|
|
a type of database often used as an interim area for a data warehouses |
Operational data stores |
|
|
example of an operational data store? |
ids at lsu games |
|
|
an operational data mart |
oper mart |
|
|
what are we aiming for? |
enterprise data warehouse and metadata |
|
|
describes the contents of a data warehouse and the manner of its acquisition and use (rules) |
metadata |
|
|
|
|
|
Should we just gather every piece of data? |
No |
|
|
Enterprise Data Warehouse |
single version of the truth |
|
|
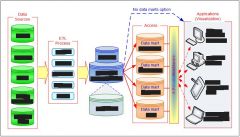
What is an example of a generic data warehouse? |
hub & spoke |
|
|
ETL processes are _________ |
necessary |
|
|
Do we do backup? |
Of Course! |
|
|
Data marts makes data ___________. |
accessible |
|
|
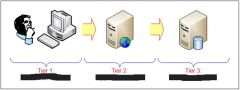
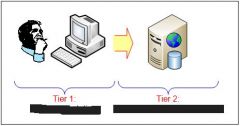
put things on different servers |
three tier architecture |
|
|
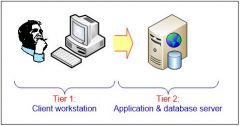
two tier architectures |
first two-tiers combined into one |
|
|
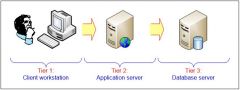
three tiers of three tier architecture |
1. data acquisition software 2. the data warehouse that contains the data and software 3. client software that allows users to access and analyze data from the warehouse |
|
|
helps serve the needs of things on a large scale |
3-tier architecture |
|
|
more economical, but performance problems |
2-tier architecture |
|
|
|
|
|
|
|
|
What are the 4 issues you need to consider when deciding which architecture to use? |
1. Which database management system (DBMS) should be used? 2. Will parallel processing and/or partitioning be used? 3. Will data migration tools be used to load the data warehouse? 4. What tools will be used to support data retrieval and analysis? |
|
|
What is parallel processing? |
multiple CPU's, quicker |
|
|
What is partitioning? |
splitting the data into smaller tables for effieciency |
|
|
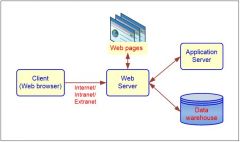
What is the internet? |
public space |
|
|
What is intranet? |
used for interior of a company |
|
|
What is extranet? |
external vendors and locals |
|
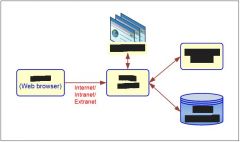
Web-based DW architecture |
|
|
|
Five points for Independent data marts architecture |
1. simplest 2. least costly 3. bad 4. difficult to analyze data across data marts 5. no single version of the truth |
|
|
atomic/summarized data |
independent data marts |
|
|
linked by conformed dimensions |
dimensional data marts |
|
|
Three points for data mart bus architecture with linked dimensional data marts |
1. may have better data consistency than independent data marts 2. .still no good 3. they are linked by software |
|
|
Seven points for Hub and Spoke |
1. easy for user interface 2. data redundancy 3. data latency 4. takes time 5. better, good solution 6. most famous, most used 7. single version of the truth |
|
|
Which DW architecture does our textbook and teradata think is the best? |
Centralized data warehouse architecture |
|
|
centralized data warehouse architecture |
centralized data warehouse |
|
|
Logical/physical integration of common data elements |
federated architecture |
|
|
mergers and acquistition |
data federation |
|
|
how do you get to the data? |
data access |
|
|
What three major processes does data integration comprise of? |
data access data federation change capture |
|
|
a techonology that provides a vehicle for pushing data from source systems into a data warehouse |
enterprise application integration (EAI) |
|
|
an evolving tool space that promises real-time data integration from a variety sources, such as relational or multidimensional databases, wed services, etc. |
enterprise information integration (EII) |
|
|
|
|
|
raw data information |
OLTP |
|
|
Two issues that affect the purchase of an ETL tool |
1. Data transformation tools are expensive. 2. Data transformation tools may have a long learning curve. |
|
|
how the data's organized |
metadata |
|
|
Four important criteria in selecting an ETL tool |
1. ability to read from and write to an unlimited number of data sources/architectures 2. automatic capturing and delivery of metadata 3. a history of conforming to open standards 4. an easy-to-use interface for the developer and the functional user |
|
|
Inmon is the... |
father of data warehousing |
|
|
EDW approach; top-down |
Inmon Model |
|
|
data mart approach; bottom-up |
Kimball model |
|
|
Which model is best between the Inmon and Kimball models? |
Either way is okay as long as you end up with EDW |
|
|
One alternative to EDW and data mart is the... |
hosted warehouse. |
|
|
a retrieval based system that supports high volume query access |
dimensional modeling |
|
|
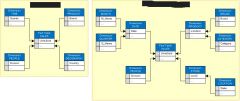
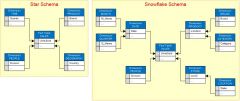
the most commonly used and the simplest style of dimensional modeling |
star schema |
|
|
example of star schema |
louisiana crash data |
|
|
Star schema contain a ____ _____ surrounded by and connected to several _________ ______. |
fact table dimension tables |
|
|
an extension of star schema where the diagram resembles a snowflake in shape |
snowflake schema |
|
|
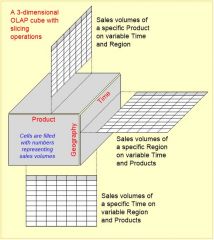
dimensions that multidimensionality can house |
sales by region, by product, by salesperson, and by time |
|
|
eight dimensions |
1. products 2. salespeople 3. market segments 4. business units 5. geographical locations 6. distribution channels 7. country 8. industry |
|
|
Five measures |
1. money 2. sales volume 3. head count 4. inventory profit 5. actual versus forecast |
|
|
Five times |
1. daily 2. weekly 3. monthly 4. quarterly 5. yearly |
|
|
two points for snowflake schema |
used less often more branched out |
|
|
|
|
|
Two points for OLTP |
1. capturing and storing data from ERP, CRM, POS.. 2. The main focus is on efficiency of routine tasks |
|
|
Five points for OLAP |
1. converting data into information for decision support 2. data cubes, drill-down/rollup, slice and dice (further and further subdividing) 3. requesting ad hoc reports 4. conducting statistical and other analysis 5. developing multimedia-based applications |
|
|
Purpose of OLTP vs. OLAP |
OLTP is to carry out day-to-day business functions; while OLAP is to support decision making and provide answers to business and management queries |
|
|
Data source of OLTP vs. OLAP |
OLTP is transaction database (a normalized data repository primarily focused on efficiency and consistency), while OLAP is a data warehouse or data mart (a nonnormalized data repository primarily focused on accuracy and completeness) |
|
|
Reporting of OLTP vs. OLAP |
OLTP is routine, periodic, narrowly-focused, while OLAP is Ad hoc, multidimensional, broadly focused reports and queries |
|
|
Resource Requires of OLTP vs. OLAP |
OLTP is ordinary relational databases, while OLAP is multiprocessor, large-capacity, specialized databases |
|
|
Execution Speed for OLTP vs. OLAP |
OLTP is fast (recording of business transactions and routine reports), while OLAP is slow (resource intensive, complex, large scale queries) |
|
|
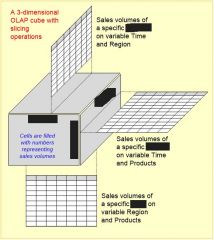
a subset of multidimensional array |
slice |
|
|
a slice on more than two dimensions |
dice |
|
|
navigating among levels of data ranging from the most summarized (up) to the most detailed (down) |
Drill down/up |
|
|
computing all of the data relationships for one or more dimensions (like drilling up) |
roll up |
|
|
used to change the dimensional orientation of a report or an ad hoc query-page display |
pivot |
|
|
single slice |
one direction |
|
|
dicing |
two directions |
|
|
3 dimensional OLAP diagram is ______. |
common |
|
|
|
|
|
summarizes transactions into multidimensional views ahead of time |
Multidimensional OLAP (MOLAP) |
|
|
The implementation of an OLAP database on top of an existing relational database |
Relational OLAP (ROLAP) |
|
|
ROLAP does not require ______________ and ______ of information |
precomputation storage |
|
|
What is ROLAP used for? |
to generate SQL queries |
|
|
Eight Data Warehouse Implementation Issues |
1. identification of data sources and governance 2. data quality planning, data model design 3. ETL tool selection 4. Establishment of service-level agreements 5. Data transport, data conversion 6. Reconciliation process 7. End-user support 8. Political issues |
|
|
Successful Data Warehouse Implementation Things to Avoid (6) |
1. starting with the wrong sponsorship chain 2. setting expectations that you cannot meet 3. engaging in politically naive behavior 4. loading the data warehouse with information just because it is available 5. believing that data warehousing database design is the same as transactional database design 6. choosing a data warehouse manager who is technology oriented rather than user oriented |
|
|
Failure Factors in Data Warehouse Projects (7) |
1. lack of executive sponsorship 2. unclear business objectives 3. cultural issues being ignored (change management) 4. unrealistic expectations 5.inappropriate architecture 6. low data quality/missing information 7. loading data just because it is available |
|
|
really good factor to consider |
scalability |
|
|
The main issues pertaining to scalability (4) |
1. the amount of data in the warehouse 2. how quickly the warehouse is expected to grow 3. the number of concurrent users 4. the complexity of user queries |
|
|
What does too many concurrent users do? |
brings down the servers |
|
|
Good scalabilities means that queries and other data-access functions... |
will grow linearly with the size of the warehouse |
|
|
What is the opposite of real-time DW/BI? |
traditional |
|
|
Enabling real-time data updates for real time ________ and real-time ________ making is growing rapidly. |
analysis decision |
|
|
____ vs. pull (of data) |
Push |
|
|
4 concerns about Real-time BI |
1. not all data should be updated continuously 2. mismatch of reports generated minutes apart 3. may be cost prohibitive 4. may also be infeasible |
|
|
pre-determined reins on schedule until you make it happen, you are a poor manager |
batch |
|
|
_____ is still done today. |
Batch |
|
|
AD hoc |
things you need as you need it |
|
|
Event-based triggering |
most benefit |
|

|
|
|
|
|
|
|
The four things a data warehouse administrator should do are... |
1. have the knowledge of high-performance software, hardware and networking technologies 2. possess solid business knowledge and insight 3. be familiar with the decision-making processes so as to suitably design/maintain the data warehouse structure 4. possess excellent communication skills
|
|
|
security and privacy is a pressing issue in Data Warehousing...(3) |
1.safeguarding the most valuable assets 2. Government regulations (HIPPA, etc.) 3. Must be explicitly planned and executed |
|
|
Future of DW sourcing (4) |
1. web, social media, and Big DAta 2. open source software 3. SaaS (software as a service) 4. Cloud computing |
|
|
Future of DW infrastructure (6) |
1. columnar 2. real-time DW 3. Data Warehouse appliances 4. data management practices/technologies 5. in-database and in-memory processing New DBMS 6. Advanced analytics |
|
|
What does KMS stand for? |
Knowledge Management System |
|
|
Report = Information --> decision then ______ |
action |
|
|
to improve managerial decisions |
purpose |
|
|
data from inside and outside the organization (via the use of ETL) |
source |
|
|
text + tables + graphs/charts |
format |
|
|
in-print, email, portal/intranet |
distribution |
|
|
You can make managerial decisions from a _________ ______. |
business report |
|
|
Business reports are... |
very common in business |
|
|
What kind of cycle is business reporting? |
Never ending |
|
|
For those executives who don't have time to go through lengthy reports, the best alternative is... |
the executive summary. |
|
|
Four keys to any successful report |
1. clarity 2. brevity 3. completeness 4. correctness |
|
|
What are the three report types? |
informal, formal, and short report |
|
|
a single letter or memo |
informal report |
|
|
10-100 pages; cover + executive summary + text |
formal report |
|
|
periodic, informative, inverstigative |
short report |
|
|
help manage business performance through outcome-oriented metrics |
metric management reports |
|
|
two examples for metric management reports |
SLAs for externals; KPIs for internals |
|
|
graphical presentation of several performance indicators in a single page using dials/gauges |
dashboard-type reports |
|
|
include financial, customer, business process, and learning & growth indicators |
balanced scorecard-type reports |
|
|
human resource management |
balanced scorecard type report |
|
|
Four points for Components of Business Reporting Systems |
1. Data storage = data + metadata 2. Business logic (how transactions are converted into metrics, scorecards and dashboards 3. Publication medium - builds the report and hosts them for users or disseminates them to users. 4. Assurance: right information to the right people in the right format; quality service |
|
|
Is data and information visualization related to information graphics, visualization and statistical graphics? |
Yes. |
|
|
2010s and beyond |
Google maps has set new standards for data visualization with its intuitive Web mapping software |
|
|
Five basic charts and graphs |
1. line chart 2. bar chart 3. pie chart 4. scatter plot 5. bubble chart |
|
|
Six specialized charts and graphs |
1. histogram 2. gantt chart 3. PERT chart 4. Geographic map 5. heat map 6. tree map |
|
|
Four points for bubble charts |
interactive animated multi-perspective high density data |
|
|
There is such a thing as a ... |
Magic Quadrant for Business Intelligence and Analytic Platforms |
|
|
Typical charts, graphs, and other visual elements used in visualization-based applications usually involve ___ __________, sometimes _____, and fairly small _______ of ____ ____. |
two dimensions three subsets of data sets |
|
|
Where do the data in Visual analytics systems reside? |
Complex data warehouses |
|
|
Visualization differs from traditional charts and graphs in __________ of data sets and use of multiple _________ and ________. |
complexity dimensions measures |
|
|
There is a strong move toward ______ _________. |
visual analytics |
|
|
Four points for visual analytics |
1. A recently coined term 2. Information visualization 3. predictive analytics 4. necessary for business 5. but then take it a step further |
|
|
a recently coined term |
information visualization + predictive analytics |
|
|
Information visualization (2) |
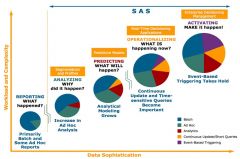
descriptive, backward focused "what happened" "what is happening" |
|
|
Predictive analytics (2) |
1. predictive, future focused 2. "what will happen" "why will it happen" |
|
|
_________ __________ are commonly used in BPM software suites and BI platforms |
Performance dashboards |
|
|
Dashboards provide visual displays of _________ ___________ that is consolidates and arranged on a ______ ______ so that information can be digested at a ______ ______ and ______ _______ __ and further ________ = ___________ _______. |
important information single screen single glance easily drilled in explored information density |
|
|
The fundamental challenge of dashboard design is to display all the required information on a ______ _____, _______ and without ___________, in a manner that can be ___________ _______. |
challenge single screen clearly without distraction assimilated quickly |
|
|
Three layers of information |
1. monitoring 2. analysis 3. management |
|
|
definition of management for performance dashboards |
detailed operational data that identify what actions to take to resolve problems |
|
|
Things to look for in a dashboard (6) |
1. use of visual components to highlight data and exceptions that require action 2. Transparent to the user, meaning that they require minimal training and are extremely easy to use 3. combine data from a variety of systems into a single, summarized, unified view of the business 4. enable drill-down, or drill-through to underlying data sources or reports 5. Present a dynamic, real-world view with timely data 6. Require a little coding to implement, deploy, and maintain |
|
|
what are you measuring? |
metrics |
|
|
3 things for metadata |
field name data type field length |
|
|
What is a good practice for dashboard design? |
wrap the metrics with contextual metadata |
|
|
Present information to 3 different levels |
1. visual dashboard level 2. static report level 3. self-service cube level |
|
|
When a user navigates the dashboard, a simple set of 8-12 KPIs can be presented, which would give a... |
sense of what is going well and what is not |
|
|
Business Performance Management (BPM) is a real-time system that ______ ________ to _________ _____________, _________ ________ and _______, and then empowers them to react through ______ and collaboration. |
alerts managers impending opportunities threats models |
|
|
BPM refers to the business processes, methodologies, _______, and ____________ used by enterprises to measure, monitor, and manage business performance. |
metrics technologies |
|
|
BPM encompasses three components |
1. a set of integrated, closed-loop management and analytic processes, suppoted by technology 2. Tools for businesses to define strategic goals and then measure/manage performance against them 3. a core set of processes - methods and tools- for monitoring key performance indicators (KPIs), linked to organizational strategy |
|
|
Closed-loop process steps (4) |
strategize plan monitor/analyze adjust |
|
|
What is strategizing the process of (2) |
1. identifying and stating the organization's mission, vision, and objectives 2. developing plans (at different levels of granularity-strategic, tactical, and operational) to achieve these objectives |
|
|
8 common tasks for the strategic planning process |
1. Conduct a current situation analysis 2. determine the planning horizon 3. conduct an environment scan 4. identify critical success factors 5. complete a gap analysis 6. create a strategic vision 7. develop a business strategy 8. identify strategic objectives and goals |
|
|
plan that translates an organization's strategic objectives and goals into a set of well-defined tactics and initiatives, resources requirements, and expected results for some future time period (usually a year) |
operational plan |
|
|
Operational planning can be (2) |
tactic-centric (operationally focused) budget centric (financially focused) |
|
|
When operational members know the ____, they will be able to come up with the ___. |
what how |
|
|
Operational and financial plans answer two questions: |
What tactics and initiatives will be pursued to meet the performance targets established by the strategic plan? What are the expected financial results of executing the tactics? |
|
|
When the operational and financial plans are underway, it is imperative that... |
the performance of the organization be monitored |
|
|
A comprehensive framework for monitoring performance should address two key issues: |
what to monitor how to monitor |
|
|
Three points for what to monitor |
KPIs Critical success factors strategic goals and targets |
|
|
one point for how to monitor |
managerial |
|
|
Act and adjust |
What do we need to do differently? |
|
|
_______ (or mere survival) depends on new projects: creating new ________, entering new _______, acquiring new _________ (or businesses), or streamlining some _______. |
Success products markets customers process |
|
|
Many new projects and ventures ____! |
fail |
|
|
a system that assists managers in tracking the implementations of business strategy by comparing actual results against strategic goals and objectives |
performance management system |
|
|
one point for performance management system |
comprises systematic comparative methods that indicate progress (or lack thereof) against goals |
|
|
Popular business performance measurement systems (4) |
balanced scorecards dashboards and scorecards Six Sigma DMAIC |
|
|
Two points for performance measurement |
helps you to manage financial and non-financial |
|
|
represents a strategic objective and metrics that measure performance against a goal |
key performance indicator |
|
|
six distinguishing features of KPIs |
strategy targets ranges encodings time frames benchmarks |
|
|
examples of key performance indicators |
level of sales level of service |
|
|
KPIs embody a _________ _________ |
strategic objective |
|
|
defined in strategy, planning or budgeting sessions and can take different forms. |
targets |
|
|
KPIs measure performance against specific _______. |
targets |
|
|
Targets have performance ______. |
ranges |
|
|
ranges are _______ in software, enabling the visual display of performance |
encoded |
|
|
can be based on percentages or more complex rules |
encodings |
|
|
often divided into smaller intervals to provide performance mileposts |
time frames |
|
|
previous year's results often serve as these, but arbitrary numbers or external benchmarks may also be used |
benchmarks |
|
|
have a significant effect on outcome KPIs, but the reverse is not necessarily true |
Driver KPIs |
|
|
Four operational areas covered by drive KPIs |
customer performance service performance sales operations sales plan/forecast |
|
|
most popular performance measurement systems in use are variants of BSC |
Balanced Scorecard |
|
|
A balanced scorecard is a performance measurement and management methodology that helps translate and organizations... |
financial, customer, internal process, and learning and growth objectives and targets into a set of actionable initiatives |
|
|
Combined set of measures for (5) |
1. financial and non-financial 2. leading and lagging 3. internal and external 4. quantitative and qualitative 5. short term and long term |
|
|
Six sigma is a performance management methodology aimed at ________ the ______ of _______ in a business process to as close to zero defects per million as possible |
reducing the number of defects |
|
|
Sigma is a symbol that statisticians use to measure the ___________ in a process; the ______ of _______. |
variability number of defects |
|
|
What are the problems for Enterprise Rental Cars? (6) |
-wants scaleability -challenge is growth -performance issues -couldn't query ad-hoc -too many data marts -not an EDW |
|
|
What does Enterprise decide that they want to do? |
replace phone calls with automated systems |
|
|
What three services did Enterprise link? |
car rentals, body shops, and insurance |
|
|
What is the only thing worse than not having data? |
having the wrong data |
|
|
electronically communicate without phone calls |
ARMS |
|
|
Five points for ARMS (enterprise) |
1. become a data provider 2. can do analytics 3. have reporting tools 4. measurement 5. business process gives them a competitive advantage |
|
|
What was Enterprise's result? |
-tri-banded report -hard information (facts) -Active data warehouse -nonvolatile (single version of truth) -Query volume went up |
|
|
Decisions, in the best interest of the customer, are based on ____. |
fact |
|
|
Three points for Enterprise Query volume going up |
1. trust the data 2. add-hoc queries 3. cut down monthly processing |
|
|
Isle of Capri Casinos Is.... |
winning with Enterprise Data Warehouse |
|
|
Four points for Capri Casinos solution |
teradata IBM Cognos management team frame their own initial queries |
|
|
What was the solution for Isle of Capri? |
They learned how to use detailed, up to the minute data and learned to write the right timely questions. |
|
|
Three points for single version of the truth. |
1. same results to queries 2. same data to support decisions 3. more dependable data |
|
|
Why is it important for Isle of Capri to have an EDW? |
the customers |
|
|
What were the business challenges or opportunities that Isle was facing? |
competition, time lag, must exceed, the customer expectations |
|
|
What was the process Isle followed to realize EDW? |
TERAdata, Cognos, they had to hire experts |
|
|
What were the benefits of implementing EDW at ISle? (3) |
timeliness and detail of data; added slot machine data; the more people go, the more they get |
|
|
Why do you think large enterprises like Isle in the gaming industry can succeed without having a capable data warehouse/business intelligence infrastructure?to |
to beat the competition |
|
|
A Better Data Plan: Well-Established TELCOs Leverage... |
Data Warehousing and Analytics to Stay on Top in a Competitive Industry |
|
|
What are the main challenges for TELCOs? (4) |
customer retention cost reduction customer acquisition social networking |
|
|
How can data warehousing and data analytics help TELCOs in overcoming their challenges? (3) |
-highly targeted data analytics solutions -gaining market share and improving profitability -competition |
|
|
Data Warehousing Helps MultiCare... |
save more lives |
|
|
What is the MultiCare case all about? |
applying data models |
|
|
What do you think is the role of data warehousing in healthcare systems like the one in the MultiCare case? (3) |
-improve efficiency and profits -want to improve patient care -provide data driven decisions |
|
|
What data does MultiCare have? |
patient leaves hospital practices patient outcomes |
|
|
How did MultiCare use data warehousing to improve health outcomes? |
-define the standards of care for septic patients -identify the patients who might likely take a turn for the worse -efficiently implement standard of care |
|
|
BP Lubricants Achieves... |
BIGS Success |
|
|
BP Lubricants benefits from implementing a data warehouse that... |
integrates data from many sources |
|
|
What was the solution for BP Lubricants? |
-implemented the pilot for its Business Intelligence and Global Standards (BIGS) program, a strategic initiative for management information and business intelligence (EDW) -to provide consolidated views |
|
|
What are the benefits for BP Lubricants? |
By improving the visibility of consistent, timely data, BIGS provides the information needed to assist the business in identifying a multitude of business opportunities to maximize margains and/or manage associated costs. |
|
|
Things that go better with... |
Coke's data warehouse |
|
|
What is Coke's case not about? |
America or Taste Preference, it's about vending machines in Japan |
|
|
What information does Coke use? |
data warehouse and analytical software by TERAdata to use historical data and near-realtime data from each vending machine that can be transmitted via wireless connection to headquarters |
|
|
What information do the vending machines tell Coke? |
detailed product information, time and date of each sale, when a product sells out, whether someone was short-changed, and whether the machine is malfunctioning |
|
|
What happens when a Coke vending machine malfunctions? |
an alert is triggered, and the vending machine immediately reports it to the data center over a wireless transmission system |
|
|
What does Coke use? |
vending machines on a wireless network to gather near-real time point of sale data from each one |
|
|
What are cokes vending machines used for? |
accurately forecast demand and identify problems quickly |
|
|
What were the results of Coke's enterprise active data warehouse implementation? |
lead to immense cost savings and higher revenue |
|
|
Starwoo Hotels and Resorts... |
Manages Hotel Profitability with Data Warehousing |
|
|
How big and complex are the business operations of Starwood Hotels & Resorts? |
large, complex, because it's global |
|
|
How did Starwood Hotels & Resorts use data warehousing for better profitability? |
active data warehouse, more efficient and profitable, increased Customer Retention Management |
|
|
What were the challenges for Starwood Hotels & resort? |
customer loyalty program (a lot of data to grab and manage) global corporate expansion (Asia/pacific regions) rise in the need for business critical information about Starwood hotels and customers Central Reservation system reports could take as long as 18 hours Delays prevented managers from adjusting rates appropriately, which could result in less revenue |
|
|
What was the solutions and results for Starwood Hotels & Resorts? |
up-to-date data; increasing efficiency and profitability improving customer service improving the company's ability to manage room occupancy rates marketing campaign management is also more efficient now that managers can analyze results in days or weeks instead of months provides hotel managers and corporate executives with near-real time information to make optimal business decisions and provide ideal amenities for our guests
|
|
|
What company did Starwood Hotels & Resorts use? |
Oracle |
|
|
EDW Helps... |
connect state agencies in Michigan |
|
|
The Michigan case provides an excellent example for a _____-_____ implementation of an __________ ____ _________ by a state government. |
large-scale integrated data warehouse |
|
|
What are the size and complexity of EDW used by state agencies in Michigan? |
large and complex |
|
|
Michigan has been ambitious in its attempts to solve ____-____ problems through the innovative _______ and comprehensive _________ of data. It's approach to BI/DW has always been statewide in nature, rather than having ________ BI/DW platforms for each business area of state agency. By removing barriers to sharing enterprise data across business units... |
real-life sharing analyses separate Michigan has leveraged massive amounts of data to create innovative approaches to the use of BI/DW, delivering efficient, reliable enterprise solutions using multiple channels. |
|
|
How does the Michigan Department of Technology, Management & Budget (DTMB) impact every area of government? |
Through customer service, resource optimization, and the innovative use of information and technology |
|
|
How much benefit (in dollars) does the Michigan Department of Technology get? |
1 million |
|
|
What does the Michigan Department of Technology do? |
Relies on EDW to do their jobs more effectively and better serve Michigan residents |
|
|
Self-Service Reporting Environment... |
Saves Millions for Corporate Customers |
|
|
Travel and Transport is a |
management company |
|
|
What is Travel and Transport's challenge? |
customers find it difficult to analyze costs or instate optimal purchase agreements crowded marketplace |
|
|
What does Travel and Transport do to fix their challenges? |
implement an integrated reporting and analysis system to enhance relationships with existing clients and attract new prospects |
|
|
What is the solution for travel and transport? |
WebFOCUS business Intelligence (BI) platform (eTTek Review), a dynamic customer self--service BI environment. It's a dashboard-driven expense-management application |
|
|
Travel and Transport used WedFOCUS to create an online system that... |
allows clients to access information directly, so they won't have to rely on the IT department to run reports for them. |
|
|
best of breed |
find what's best |
|
|
What does a Peer-reviewed system do for Travel and Transport? |
requires no client-side software |
|
|
Travel and Transport had a need to... |
create and effectively communicate a value proposition to its existing and potential customers |
|
|
The key for Travel and Transport was to provide value-added services to the clients so that they can... |
efficiently analyze costs and other options to quickly instate optimal purchase agreements. |
|
|
Delta Lloyd group ensures.... |
accuracy and efficiency in financial reporting |
|
|
The Delta Lloyd group is a great example for... |
overcoming the challenges of financial reporting. |
|
|
What is the most challenging part of the reporting process for Delta Lloyd? |
the last mile--the stage at which the consolidated figures are cited, formatted, and described to form the final text of the report. |
|
|
Flood of Paper... |
ends at FEMA |
|
|
Challenge for FEMA |
"flood of paper"
|
|
|
What did FEMA do? |
use WebFOCUS software from the Information Builders to work together with national insurance companies to collect flood insurance premiums and pay claims for flooding in communities that adopt flood control measures |
|
|
What does FEMA use? |
BureauNet intranet site to select just information they want to see and get an on-screen report or download the data as a spreadsheet. Plus self-generated reporting |
|
|
Tableau saves Blastrac thousands of dollars with... |
simplified information sharing |
|
|
The Tableau/Blastrac case show how visual reporting tools can help... |
facilitate cost-effective business information creation and sharing |
|
|
What did Blastrac depend on? |
the creation and distribution of reports across the organization to make business decisions |
|
|
What were Blastrac's challanges |
did not have a consistent reporting method in place preparation of reports was tedious They had to use Excel and pivot tables massive spreadsheets were inaccurate and consistently hard to understand BI had been eliminated because of cost |
|
|
What did Blastrac do? |
deployed two visualization tools from Tableau software: Tableau Desktop to create reports and Tableau Reader to view and filter reports |
|
|
What is Blastrac's result? |
only one hour per week is now required to create reports, and the reports are automatically updated through Tableau. They are now able to proactively identify major business events reflected in company data instead of reacting to incoming questions from employees as they had been forced to do previously better information shearing |
|
|
TIBCO Spotfire provides Dana-Farber Cancer Institute with... |
unprecendented insight into cancer vaccine clinical trials |
|
|
What was Dana-Farber's challenge? |
great inconsistency and redundancy inherent in the data registry very difficult and time-consuming to analyze information from the multiple data sources separately, in order to understand the relationships underlying the data or identify trends and patterns using spreadsheets |
|
|
For Dana-Farber Cancer institute to attempt to use a traditional business intelligence tool, it would have required... |
significant IT resources. |
|
|
For exploration and discover, Dana-Farber used |
TIBCO Spotfire DXP (Spotfire) computational and visual analytics tool |
|
|
What did TIBCO provide Dana-Farber with? |
a better understanding of the cancer vaccine clinical trials landscape and enables rapid insight into the hot-spots of cancer vaccine activity, as well as into the identification of neglected cancers. |
|
|
Saudi Telecom Company... |
excels with information visualization |
|
|
What is featured in the Saudi Telecom company? |
an interesting and informative dashboard-driven reporting solution built specifically for a very large telecommunication company. |
|
|
Why do you think telecommunication companies like Saudi Telecom are among the prime users of information visualization tools? |
have millions of customers and contacting them constantly for billing, payment, network usage, and support information is monitored in a timely way. |
|
|
How did Saudi Telecom use information visualization? |
Dundas Dashboards show relevant metrics and KPI's. |
|
|
What were the challenges and benefits for Saudi Telecom? |
C- prioritizing and contextualizing the data are paramount in understanding it B- allowed us to see trends and correct issues before they became problems. -reduced service tickets |
|
|
IBM Cognos Express Helps... |
Mace for Faster and Better Business Financial Reporting |
|
|
Two points for Mace |
integrated reporting system got away from big, complicated spreadsheets |
|
|
What was the reporting challenge Mace was facing? |
Excel Spreadsheets |
|
|
What was the approach for a potential solution for Mace? |
Drill down, automatic KPIs |
|
|
Expedia.com's... |
Customer Satisfaction Scorecard |
|
|
Who are the customers for Expedia.com? Why is customer satisfaction a very important part of their business? |
People who go on the website If they're not happy, you'll fail |
|
|
What are the three steps for Expedia.com? |
1. Deciding how to measure satisfaction 2. Setting the right performance targets 3. Putting data into context |