Reading...
![]()
Play button
![]()
Play button
![]()
Use LEFT and RIGHT arrow keys to navigate between flashcards;
Use UP and DOWN arrow keys to flip the card;
H to show hint;
A reads text to speech;
40 Cards in this Set
- Front
- Back
|
What is PPF?
|
It's a production possibility curve (PPC) which shows the maximum combinations of goods and services that can be produced at that time if all the resources are being used fully. This is the "Potential output" or the production possibility frontier (PPF)
|
|
|
What shape is PPF and why?
|
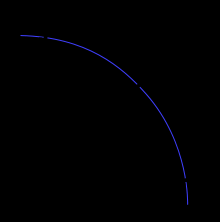
It's concave because of the law of diminishing returns. Which means not all resources can be transferred between different uses without some cost or time.
|
|
|
How is the opportunity cost on a PPC measured
|
By the number of units of the 2nd goof forgone if an additional unit of the first good is made
|
|
|
What are the two types of economic growth?
What are their definitions? |
Actual Growth: when there is a movement from a point inside the PPF towards the curve. Achieved by using the resources better
Potential growth: When there is an outwards shift of the PPF achieved by the quantity or quality of resources |
|
|
What is demand?
|
The quantity of goods and services that consumers are able and willing to buy at a certain price
|
|
|
What is the law of demand?
|
Under ceteris paribus, a change in price will lead to a change in quantity demanded.
|
|
|
What is the income effect?
|
If the price of a good falls and your income remains the same, you can now buy more goods
|
|
|
What is the substitution effect?
|
If the price of a good falls, what has really happened to the price of alternative goods (substitutes)
|
|
|
What does the demand curve assume?
|
There is a competitive market and perfect knowledge.
|
|
|
What factors determines demand?
|
Price, income, substitute goods, complement goods, taste and preferences, expectations, population and season (umbrella for example)
|
|
|
What is the law of supply?
|
As the price of a product rises, the quantity supplied will usually increase with ceteris paribus.
|
|
|
What causes a movement along the supply curve?
|
A change in the price
|
|
|
What determines supply?
|
Cost of factors of production
Changes in technology Government intervention (indirect taxes or subsidies) |
|
|
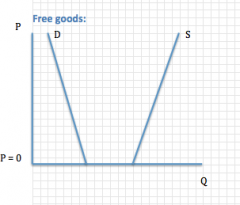
Diagram for a free good
|
|
|
|
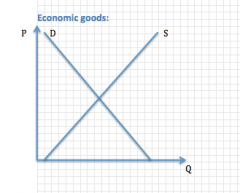
Diagram of an economic good
|
|
|
|
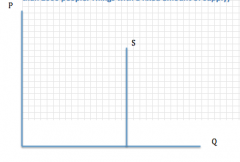
Diagram of an economic good with a fixed supply
|
|
|
|
What is allocative efficiency?
|
What to produce
|
|
|
What is productive efficiency?
|
How to produce
|
|
|
What are price controls?
|
maximum prices (price ceilings), minimum prices (price floors), and commodity agreements
|
|
|
Maximum price:
Situation? Purpose? Problem? Solutions? +graphs |
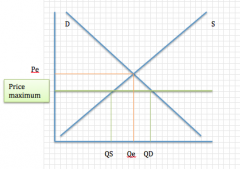
Situation: government will set a maximum price below the equilibrium
Purpose: usually to protect the consumer Problem: create excess demand (shortages), black markets and queues may result Solutions: shift demand to the left (but this will mean less consumption), or shift supply to the right (via subsidies) |
|
|
Minimum price:
Situation? Purpose? Problem? Solutions? + Graph |
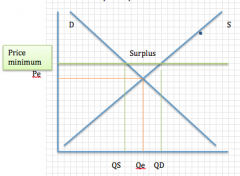
Situation: government will set a minimum price above the equilibrium
Purpose: raise income for producers or protect workers (minimum wage) Problem: excess supply Solutions: government could buy the surplus (can be then destroyed or sold to another country), impose quotas, or attempt shift the demand curve to the right through advertising, and restricting imported products |
|
|
Commodity agreements:
Situation? Purpose? + Graph |
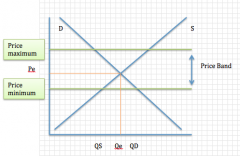
Situations: when countries operate buffer stock schemes together for a particular commodity
Purpose: alleviate difficulties in some countries (especially developing) which are reliant on commodity exports but which suffer from these products having low products |
|
|
What are the 4 types of elasticity?
|
Price elasticity of demand (PED)
Cross elasticity elasticity of demand (XED) Income elasticity of demand (YED) Price elasticity of supply (PES) |
|
|
What is PED and what is the formula?
|
PED (price elasticity of demand) It's the measure of how much the quantity demanded of a product changes when there is a change in the price of a product
%change in quantity demanded of the product/ %change in price of the product |
|
|
In PED when is it inelastic and elastic?
|
Inelastic: PED = 1, 1>PED>0
Elastic: ∞>PED>1 |
|
|
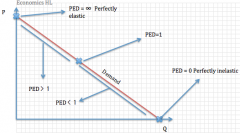
Theoretical PED's (perfectly inelastic and elastic)
|
Perfectly inelastic when PED = 0
Perfectly elastic when PED = ∞ |
|
|
Determinants of price elasticity
|
1. Availability of substitute goods (product with many substitute goods are usually more elastic)
2. Necessity of the product (the bigger the need the more inelastic) 3. Time period (takes time for consumers o react to a change in price) 4. How widely it's defined (meat>chicken>chicken nuggets>McDonals nuggets) 5. Price of product (the cheaper the product, the more inelastic) |
|
|
PED graph
|
|
|
|
What is XED and what is the formula?
|
XED (cross elasticity of demand) determines the relation between two goods (Compliment, unrelated or substitutes)
XED = %change in QD of product X / % Change in Price of product Y |
|
|
What does it mean when XED is positive, negative or 0?
+ graph |
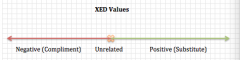
positive: two goods are substitutes (coke and pepsi)
negative: two goods are compliments (bread and butter) 0: unrelated (phones and candles) |
|
|
What is PES and what is the formula?
|
PES (price elasticity of supply) It's a measure of the responsiveness of quantity supplied for a good or service to change in its price
PES = %Change in Quantity supplied of the product / %Change in price of the product |
|
|
PES when is it inelastic, elastic or unit elastic?
+ Graph |
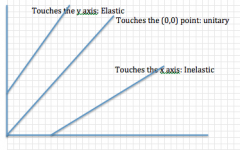
Inelastic: 1>PES>0
Elastic: ∞>PES>1 Unit elastic: PES = 1 |
|
|
In PES what are the costs of inputs?
|
If the cost of production increase significantly as supply increases then the producers may decide not to raise the supply, therefore PES will be inelastic. Even if price increase, it will take larger rises to make increasing the supply worthwhile
|
|
|
In PES why do you have to consider the time period?
|
Immediately, PES may be very inelastic as supply may be hard to increase straight away.
Short run, producers have the ability to increase some of the factors of production but not all, so PES is more elastic than the immediate Long run: PES is likely to be much more elastic as firms can increase the quantity f all factors of production. |
|
|
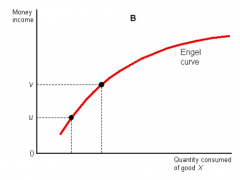
What is YED and what it the formula?
|
It calculates how much the demand for a product changes when there is a change in the consumer's income.
%change in quantity demanded of the product/ %change in income of the consumer |
|
|
What does it mean when YED is positive, negative?
|
Positive: normal good
1>YED>0: income elastic 1<YED: income inelastic Negative: inferior good |
|
|
What is a normal good?
|
Demand increases as income increases
|
|
|
What is an inferior good?
|
Demand decreases as income increases
|
|
|
What is a superior good?
|
Have a high elasticity demand. As income rises, the buyers can buy the products that they want
|
|
|
YED graph?
|
|