Reading...
![]()
Play button
![]()
Play button
![]()
Use LEFT and RIGHT arrow keys to navigate between flashcards;
Use UP and DOWN arrow keys to flip the card;
H to show hint;
A reads text to speech;
15 Cards in this Set
- Front
- Back
|
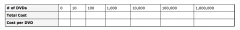
John makes DVDs of his friends' shows. He realized that, because of his fixed costs, his average cost per DVD depends on the number of DVDs he produces. The cost of producing DVDs is given by C(x)=2500+1.25x. John wants to figure out how much to charge for the DVDs in order to cover his costs. If John made 100 DVDs, find the total cost and the cost per DVD.
|
C(x)=2500+1.25x
C(100)=2500+1.25(100) C(100)=$2625 Total cost = $2625 $2625/100= $26.25 per DVD |
|
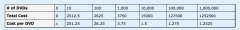
John makes DVDs of his friends' shows. He realized that, because of his fixed costs, his average cost per DVD depends on the number of DVDs he produces. The cost of producing DVDs is given by C(x)=2500+1.25x. Complete the table showing Johns' costs at different levels of production.
|
|
|
|
John makes DVDs of his friends' shows. He realized that, because of his fixed costs, his average cost per DVD depends on the number of DVDs he produces. The cost of producing DVDs is given by C(x)=2500+1.25x. Based on the table, why does the average cost per DVD level off?
|
The reason the average cost is changing is because of the fixed cost of $2500. As more DVDs are produced, the fixed cost is shared by so many DVDs that it barely adds anything to the cost of each DVD. The average cost levels off at $1.25, which is what each addition DVD adds to the cost function.
|
|
|
John makes DVDs of his friends' shows. He realized that, because of his fixed costs, his average cost per DVD depends on the number of DVDs he produces. The cost of producing DVDs is given by C(x)=2500+1.25x. Find an equation for the average cost per DVD of producing x DVDs.
|
To find the average cost function, divide the total cost by the number of DVDs produced (x), which gives us (2500+1.25x)/x
|
|
|
John makes DVDs of his friends' shows. He realized that, because of his fixed costs, his average cost per DVD depends on the number of DVDs he produces. The cost of producing DVDs is given by C(x)=2500+1.25x. Find the domain of the average cost function.
|
The domain for the average cost function is the set of positive integers. It obviously makes no sense to consider producing a negative or fractional number of DVDs, and you cannot calculate average cost if there are no DVDs produced, so the domain cannot include 0 either.
|
|
|
John makes DVDs of his friends' shows. He realized that, because of his fixed costs, his average cost per DVD depends on the number of DVDs he produces. The cost of producing DVDs is given by C(x)=2500+1.25x. Using the data from your table, sketch the graph of the average cost function. How does the graph reflect that the average cost levels off?
|
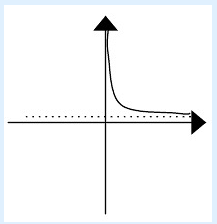
As you follow the graph to the right (i.e. as the number of DVDs produced increases), the graph gets closer and closer to the dotted line, which is the a horizontal asymptote of the graph. (SKETCH OF GRAPH 1)
|
|

An epidemic of influenza spreads through a city. The figure below is the graph of I=f(w), where I is the number of individuals (in thousands) infected w weeks after the epidemic begins. Estimate f(2) and explain its meaning in terms of the epidemic.
|
Based on the graph, I≈7 when w=2. This means that approximately 7000 people were infected two weeks after the epidemic began.
|
|

An epidemic of influenza spreads through a city. The figure below is the graph of I=f(w), where I is the number of individuals (in thousands) infected w weeks after the epidemic begins. Approximately how many people were infected at the height of the epidemic? When did that occur? Write your answer in the form of f(a)=b.
|
The height of the epidemic occurred when the largest number of people were infected. To find this, we look on the graph to find the largest value of I, which seems to be approximately 8.5, or 8500 people. This seems to have occured when w=4, or 4 weeks after the epidemic began. Therefore, the height of the epidemic corresponds to f(4)=8.5
|
|

An epidemic of influenza spreads through a city. The figure below is the graph of I=f(w), where I is the number of individuals (in thousands) infected w weeks after the epidemic begins. For approximately which w is f(w)=4.5? Explain what the estimates mean in terms of the epidemic.
|
Based on the graph, there are 2 values of w at which I=4.5, which are w≈1 and w≈10. This means that 4500 people were infected after the first week when the epidemic was on the rise, and that after the tenth week, when the epidemic was slowing, 4500 people remained infected.
|
|
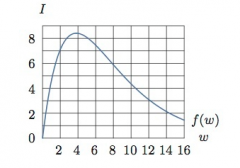
An epidemic of influenza spreads through a city. The figure below is the graph of I=f(w), where I is the number of individuals (in thousands) infected w weeks after the epidemic begins. An equation for the function used to plot the graph shown is f(w)=6w(1.3)^-w. Use the graph to estimate the solution of the inequality 6w(1.3)^-1≥6. Explain what the solution means in terms of the epidemic.
|
Based on the graph, f(w)≥6 seems to happen when w≥1.5 and w≤8. This means that more than 6000 people were infected starting in the middle of the second week and lasting until the end of the eighth week.
|
|
|
The school assembly is being held over the lunch hour in the school gym. All the teachers and students are there by noon and the assembly begins. About 45 minutes after the assembly beings, the temperature in the gym remains a steady 77 degrees Fahrenheit for a few minutes. As the students leave after the assembly ends at the end of the hour, the gym begins to slowly cool down. Let T denote the temperature of the gym in degrees F and M denote the time, in minutes, since noon. Is M a function of T? Explain.
|
M is not a function of T. The problem states tha the temperature, T, remains a steady 77 degrees F for a few minutes, M. Therefore, there is more than one value of M associated with T=77 meaning that M is not a function of T.
|
|
|
The school assembly is being held over the lunch hour in the school gym. All the teachers and students are there by noon and the assembly begins. About 45 minutes after the assembly beings, the temperature in the gym remains a steady 77 degrees Fahrenheit for a few minutes. As the students leave after the assembly ends at the end of the hour, the gym begins to slowly cool down. Let T denote the temperature of the gym in degrees F and M denote the time, in minutes, since noon. Is T a function of M? Explain.
|
T is a function of M because for each number of minutes M after noon, there can only be one and only one temperature T in the room. The temperature in the room at 12:30 cannot be 77 degrees AND 84 degrees, for example.
|
|
|
The school assembly is being held over the lunch hour in the school gym. All the teachers and students are there by noon and the assembly begins. About 45 minutes after the assembly beings, the temperature in the gym remains a steady 77 degrees Fahrenheit for a few minutes. As the students leave after the assembly ends at the end of the hour, the gym begins to slowly cool down. Let T denote the temperature of the gym in degrees F and M denote the time, in minutes, since noon. Consider the function T=g(M). Interpret the meaning of g(0) in the context of the problem.
|
The quantity g(0) represents the value of T when M=0, meaning that it represents the temperature at zero minutes past noon, or at the time when the assembly started.
|
|
|
The school assembly is being held over the lunch hour in the school gym. All the teachers and students are there by noon and the assembly begins. About 45 minutes after the assembly beings, the temperature in the gym remains a steady 77 degrees Fahrenheit for a few minutes. As the students leave after the assembly ends at the end of the hour, the gym begins to slowly cool down. Let T denote the temperature of the gym in degrees F and M denote the time, in minutes, since noon. Write an equation to represent this statement: "The temperature increased 5 degrees in the first half hour after the assembly began.
|
The equation needs to show that the change in temperature between the time the assembly started (g(0)) and thirty minutes after the assembly started (g(30) is 5 degrees. This can be shown as such: g(0)-g(30)=5
|
|
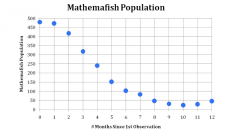
Estimate the rate of change for the function shown in this graph during the 1st and 6th months since the first observation. What does this quantity represent?
|
m=∆Y/∆X
m=103-72/6-1 m=-369/5 m=-73.8 This represents a loss of 73.8 fish per month. |