![]()
![]()
![]()
Use LEFT and RIGHT arrow keys to navigate between flashcards;
Use UP and DOWN arrow keys to flip the card;
H to show hint;
A reads text to speech;
127 Cards in this Set
- Front
- Back
|
Wilhelm Wundt |
Founded the first psychological laboratory in 1879 and brought together work in philosophy, physiology, and psychophysics to create a new field. |
|
|
Hermann Ebbinghaus |
Demonstrated that higher mental processes could be studied using experimental methodology.
Studied memory using nonsense syllables. |
|
|
Oswald Kulpe |
Believed in imageless thought (in strong disagreement with Wundt). |
|
|
James McKeen Cattell |
Studied under Wundt.
Introduced mental testing in the United States. |
|
|
Binet-Simon test |
An intelligence test that measured mental age. |
|
|
Mental age |
The age level at which a person functions intellectually, regardless of chronological age. |
|
|
William Stern |
Developed the intelligence quotient (IQ). |
|
|
IQ |
Intelligence quotient; an equation that compares mental age with chronological age. |
|
|
Stanford-Binet Intelligence Test |
The Binet-Simon test as revised for use in the United States. |
|
|
Hypothesis |
A tentative and testable explanation of the relationship between two or more variables; the first step in research design. |
|
|
Variable |
A characteristic or property that varies in amount or kind and can be measured. |
|
|
Operational definition |
The way in which a researcher plans to define the variables in an experiment so that they are measurable. |
|
|
Independent variable |
The variable whose effect is being studied and is manipulated by a research design. |
|
|
Dependent variable |
The response that is expected to vary with differences in the independent variable. |
|
|
What are the 3 types of research? |
1. True experiments
2. Quasi-experiments
3. Correlational studies |
|
|
Correlational study |
A study in which the independent variable is measured but not manipulated. |
|
|
Random assignment |
A condition in which participants in a study are assigned to a condition at random (out of the control of the researcher). |
|
|
True experiment |
A study in which random assignment and manipulation of the independent variable are both present. |
|
|
Quasi-experimental design |
A study in which random assignment is not used, therefore, insufficient control over the variables does not allow for definitive statements or causal factors to be made. |
|
|
Naturalistic observation |
Also known as field study; observing how variables behave without any intervention. |
|
|
Sample |
A subset of a population for which a researcher hopes to generalize the results of a study. |
|
|
Random selection |
A technique in which each member of a population has an equal chance of being selected for the sample. |
|
|
Stratified random sampling |
A technique in which each subgroup of the population is randomly sampled in proportion to size. |
|
|
Between-subjects design |
A study in which each subject is exposed to only one level of each independent variable. |
|
|
Matched-subjects design |
A study in which subjects are matched based on the variable that the researcher wants to control. |
|
|
Within-subjects design |
A study in which the same group of subjects is exposed to more than one condition allowing researchers to separate effects of individual differences |
|
|
Counterbalancing |
A method of controlling the potential effects of unintended independent effects by assigning all subjects with all test levels but in different order. |
|
|
Confounding variable |
An unintended independent variable that interferes with inferring causality. |
|
|
Control group design |
A study in which both groups are treated equally in all respects except that the control group does not receive the treatment and the experimental group does. |
|
|
Nonequivalent group design |
A study in which the control group is not necessarily similar to the experimental group since the researcher does not use random assignment; often used in educational research because students cannot be randomly assigned to classrooms. |
|
|
Experimenter bias |
The fact that the experimenter might inadvertently treat groups of subjects differently or interpret the results based on his or her expectations. |
|
|
Double-blinding |
A research condition in which neither the researcher or the subjects know which conditions will be assigned to which subjects. |
|
|
Single-blinding |
A research condition in which the researcher knows which conditions are assigned to which subjects. |
|
|
Demand characteristics |
Any cues that suggest to subjects what the researcher expects from them. |
|
|
Placebo effect |
A therapeutic response resulting from an inactive substance, such as a sugar pill. |
|
|
Hawthorne effect |
A tendency of people to behave differently if they know they are being observed. |
|
|
External validity |
How generalizable the results of an experiment are. |
|
|
What are two types of statistics in psychology? |
1. Descriptive statistics
2. Inferential statistics |
|
|
Descriptive statistics |
The organizing, describing, quantifying, and summarizing a collection of actual observations. |
|
|
Inferential statistics |
Mathematical study that allows for the generalization of information beyond actual observations. |
|
|
Frequency distribution |
A graphic representation of how often each value occurs in a data set. |
|
|
What are three measures of central tendency and what do they provide? |
1. Mode
2. Median
3. Mean
These measures provide estimates of the average score. |
|
|
Mode |
The value of the most frequent observation in a data set. |
|
|
Bimodal |
The description of a data set that has two values that are tied for being the most frequently occurring. |
|
|
If all of the values in a distribution occur with equal frequency, what is true of the mode? |
There is no mode. |
|
|
Median |
The middle value when observations are ordered from least to most or vice versa (the mathematical middle point). |
|
|
Mean |
The arithmetic average. |
|
|
Outliers |
Extreme scores. |
|
|
Variability |
Also known as dispersion; A description of the distribution of scores. |
|
|
What are the three measures of variability? |
1. Range
2. Standard deviation
3. Variance |
|
|
Range |
In a data set, the smallest number in the distribution subtracted from the largest number. |
|
|
Standard deviation |
A measure of the typical distance of scores from the mean. |
|
|
Variance |
The square of the standard deviation; a description of how much each score varies from the mean. |
|
|
There can be no ____________ values in the measure of distance, so standard deviation and variance must be either ____________ or ___________ |
1. negative
2. 0
3. a positive number |
|
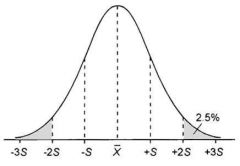
Identify the standard deviation values of this normal distribution. |
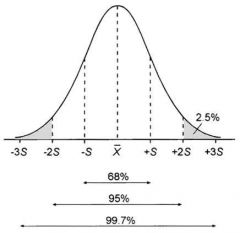
S= 34%
2S= 14%
3S= 2%
|
|
|
Percentile |
The percentage of scores that fall at or below a particular score.
To calculate the percentile represented by a z-score, add up all of the percentages to the left of the z-score. |
|
|
Z-score |
A score that represents how many standard deviations above or below the mean a score is.
z-score= item score - mean of distribution __________________________________ standard deviation |
|
|
Where do positive and negative z-scores fall in a distribution? |
Negative z-scores are below the mean and positive z-scores are above the mean. |
|
|
T-scores |
A test score that is converted to a normal distribution that has a mean of 50 and a standard deviation of 10. |
|
|
Correlation coefficient |
Measures to what extent, if any, two variables are related.
These values range from -1.00 to +1.00. |
|
|
Positive correlation |
A change in value of one of the variables tends to be associated with a change in the same direction of the value of the other variable. |
|
|
Negative correlation |
A change in the value of one of the variables tends to be associated with a change in the opposite direction of the other variable. |
|
|
Correlation does not imply ________________. |
Causation |
|
|
A perfect correlation would have a value of ___________. |
+1 or -1 |
|
|
Scatterplot |
The graphic representation of correlational data. |
|
|
Best-fitting straight line |
A line that passes through a scatterplot to indicate the direction of the correlation. |
|
|
Factor analysis |
A statistical technique using correlation coefficients to reduce a large number of variables to a few factors. |
|
|
Factor |
A cluster of variables highly correlated with each other is assumed to be measuring the same thing. |
|
|
Significance test |
A tool researchers use to draw conclusions about populations based upon research conducted on samples; can tell researchers the probability that observed differences are due to chance. |
|
|
Alternative hypothesis |
Also known as a research hypothesis; the hypothesis put forth in a research study. |
|
|
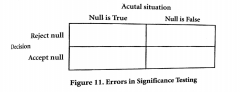
Null hypotheses |
Other explanations for phenomena observed during a research study. If this is supported, then the phenomena are due to chance. |
|
|
Statistically significant |
If an alpha level is less than or equal to 5, this is determined and the null hypothesis is rejected. |
|
|
Alpha level |
The criterion of significance. |
|
|
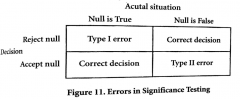
|
|
|
Beta |
The probability of making a Type II error. |
|
|
T-test |
Used to compare the means of two groups. |
|
|
ANOVA |
Used to compare the means of more than two groups and to determine if there is any interaction between two or more independent variables. |
|
|
Chi-square test |
Tests the equality of two frequencies or proportions. |
|
|
F ratio |
= Between-group variance estimate _____________________________________ Within-group variance estimate
The equation used to calculate ANOVAs. |
|
|
What does an F ratio nearing zero indicate? |
That the mean scores are about the same for each group. |
|
|
An interaction between two independent variables occurs whenever the effects of one independent variable are ______________ for all levels of the second independent variable. |
not consistent. |
|
|
Chi-squared tests are significance tests that work with ________________ rather than ________________ data. |
categorical, numerical |
|
|
Nominal |
Categorized measurement is named this way because it involves classifying or naming. |
|
|
Factorial design ANOVAs |
Each level of a given independent variable occurs with each level of the other independent variables. |
|
|
Meta-analysis |
A statistical procedure that can be used to make conclusions on the basis of data from different studies. |
|
|
Norm-referenced testing |
Assessing an individual's performance in terms of how that individual performs in comparison to others. |
|
|
Test norms are derived from _____________ samples. |
standardized. |
|
|
Domain-referenced testing |
Also called criterion-referenced testing; concerned with the question of what the test taker knows about a specified content domain. |
|
|
Reliability |
The consistency with which a test measures its subject. |
|
|
Standard error of measurement (SEM) |
An index of how much, on average, we expect a person's observed score to vary from the score the person is capable of receiving based on actual ability. |
|
|
What are the 3 basic methods used to establish the reliability of a test? |
1. Test-retest
2. Alternate-form
3. Split-half |
|
|
Test-retest method |
A method in which the same test is administered to the same group of people twice. |
|
|
What does the test-retest method measure? |
The inter-individual stability of test scores over time. |
|
|
Alternate form method |
A method in which the examinees are given two different forms of a test that are taken at two different times. |
|
|
Split-half reliability |
A method in which test-takers take only one test, but that one test is divided into two equal halves and scores on one half are correlated with the scores on the other half. |
|
|
What correlation coefficient indicates a high level of reliability? |
Greater than or equal to +.80. |
|
|
Validity |
The extent to which a test actually measures what it purports to measure. |
|
|
Content validity |
How well the content items of a test measure the particular skill or knowledge area that it is supposed to measure. |
|
|
Face validity |
Whether or not the test items appear to measure what they are supposed to measure. |
|
|
Criterion validity |
How well the test can predict an individual's performance on an established test of the same skill or knowledge area. |
|
|
Cross validation |
The testing of criterion validity of a test on a second sample after validity has been demonstrated using an initial sample. |
|
|
Construct validity |
How well a test measures the intended theoretical construct. |
|
|
Convergent validity |
If two constructs are related, then a person who scores high on a test of one construct should score high on a test of the other construct. |
|
|
Discriminant validity |
If two constructs are not related, then a person who scores high on a test of one construct should score low on a test of the other construct. |
|
|
What are the 4 basic types of measurement scales? |
1. Nominal
2. Ordinal
3. Interval
4. Ratio |
|
|
Ordinal scale |
Observations are ranked in terms of size or magnitude. |
|
|
Interval scale |
Actual numbers (but not ranks) are used for scoring. |
|
|
Ratio scaling |
Equal intervals are used in a measure wherein there is a true zero point that indicates the total absence of the quality being measured. |
|
|
What are the 2 types of ability tests? |
1. Aptitude tests
2. Achievement tests |
|
|
Aptitude tests |
Used to predict what one can accomplish through training. |
|
|
Achievement tests |
Attempt to assess what one knows or can do now. |
|
|
ratio IQ = |
mental age _____________________ x 100 chronological age |
|
|
Deviation quotients |
Tells us how far away a person's IQ score is from the average score for the particular age group the subject is a member of. |
|
|
Wechsler tests |
Tests that have all items of a given type grouped into subtests and these items are arranged in order of increasing difficulty within each subset.
Include WPPSI-R, WISC-R, WAIS-R, and WAIS-III |
|
|
Personality inventory |
A self-rating device usually consisting of statements that a subject is asked to determine if they apply to him or her. |
|
|
Minnesota Multiphasic Personality Inventory (MMPI) |
A widely used personality inventory that measures ten clinical scales and can indicate whether a person is careless, faking answers, misrepresenting him or herself, or distorting responses. |
|
|
Empirical criterion-keying approach |
Approach used in the development of the MMPI in which questions that were tested were retained if they differentiated between patient and non-patient populations. |
|
|
California Psychological Inventory (CPI) |
A personality inventory based on the MMPI that is typically used on high school and college students and measures such personality traits as dominance, sociability, self-control, and femininity. |
|
|
Projective tests |
Tests in which ambiguous stimuli are provided and subjects are to interpret them. Results are scored subjectively. |
|
|
Rorschach test |
A projective test in which subjects are provided with inkblots in a specific order and given specific instructions to interpret them and the clinician interprets the results. |
|
|
Thematic Apperception Test (TAT) |
A projective test in which a subject is provided with 20 simple pictures depicting scenes that have ambiguous meanings and asked to tell a story about what is happening. Scoring is not standardized. |
|
|
Blacky pictures |
A projective test devised for children in which 12 cartoonlike pictures feature a dog and the test taker is asked to tell stores about the pictures. |
|
|
Rotter Incomplete Sentences Blank |
A projective technique using sentence completion to measure whatever is on the test taker's mind. |
|
|
Barnum effect |
The tendency of people to accept and approve of the interpretation of their personality that is given to them. |
|
|
Interest testing |
Used to assess an individual's interest in different lines of work. |
|
|
Strong-Campbell Interest Inventory |
An inventory organized like a personality inventory that measures a subject's like or dislike of particular interests. |
|
|
RIASEC |
Acronym for realistic, investigative, artistic, social, enterprising, and conventional.
These are the categories that are being measured in the Strong-Campbell Interest Inventory. |