Reading...
![]()
Play button
![]()
Play button
![]()
Use LEFT and RIGHT arrow keys to navigate between flashcards;
Use UP and DOWN arrow keys to flip the card;
H to show hint;
A reads text to speech;
7 Cards in this Set
- Front
- Back
|
Statistics can be used to gain information about a population by examining a ___________ of the population.
|
Statistics can be used to gain information about a population by examining a sample of the population
|
|
|
Generalizations from a sample are only _______ if the sample is representative of the entire population.
|
Generalizations from a sample are only valid if the sample is representative of the entire population.
|
|
|
Random sampling tends to produce ____________ samples and support __________ inferences.
|
Random sampling tends to produce representative samples and support valid inferences
|
|
|
Kevin threw some red pieces of paper into the air, and then collected 2 pieces that landed on the floor. Is this a random sample of the red pieces of paper?
|
Yes, it is a random sample because every piece of paper he threw in the air has an equal chance of being chosen.
|
|
|
Lewis is trying to determine the bus stop location where the most people get on the bus. He surveys every third student coming off the bus, asking them where they get on the bus. Will this data represent a random sample? How could Lewis improve his research?
|
This data will not represent a random sample because every student does not have an equal chance of being chosen for the survey. Lewis should ask every student coming off the bus where they got on.
|
|
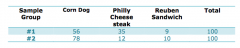
An office building is considering opening a cafeteria on the first floor. Management collected data from two random samples of 100 employees regarding their lunch preference. Make two inferences based on the results shown in this table.
|
Student may infer several things, examples include: 1. Most employees prefer corn dogs, 2. Reuben sandwiches are not very popular, etc.
|
|
|
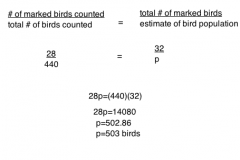
A computer tracking chip company wants to test their tracking chips. They marked 32 birds by attaching computer chips to their legs. Later on, they catch 440 birds, 28 of which are marked with computer chips. They provided this data to animal welfare authorities to estimate the bird population. To the nearest whole number, what is the best estimate of the bird population?
|
|