Reading...
![]()
Play button
![]()
Play button
![]()
Use LEFT and RIGHT arrow keys to navigate between flashcards;
Use UP and DOWN arrow keys to flip the card;
H to show hint;
A reads text to speech;
18 Cards in this Set
- Front
- Back
|
A statistical question is one that anticipates _________ in the data related to the question.
|
A statistical question is one that anticipates variability in the data related to the question.
|
|
|
The answer to a statistical question accounts for ________ in the data related to the question.
|
The answer to a statistical question accounts for variability in the data related to the question.
|
|
|
Which of the following is not a statistical question? Why not? A. How old am I? B. How old are the students in my school?
|
B is a statistical question becuase it anticipates that there will be variability in the students' ages. A is not a statistical question because the answer will be a single number, with no variability.
|
|
|
What is the median for the following set of test scores? 3, 6, 5, 4, 2, 1, 1
|
The median is 3
|
|
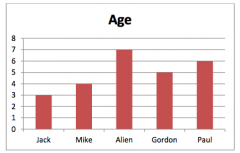
The gym teacher made this graph showing the ages of her students. What is the median age of her students?
|
The median age is 5 years old (Gordon).
|
|
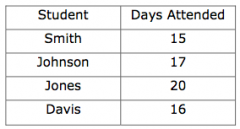
This table shows the number of days math students attended extra help after school what is the mean, median, and range in number of days for the data set?
|
mean: 17 median: 16.5 range: 5
|
|
|
This graph shows the height of members of a hiking club. What is the mean and median heights of the hikers?
|
mean: 10.5 median: 4
|
|
|
A bakery sold the following number of cakes over the last 7 days: 22, 35, 56, 44, 62, 40, 60. How many cakes were sold in the last 7 days?
|
319 cakes were sold in the last 7 days.
|
|
|
A bakery sold the following number of cakes over the last 7 days: 22, 35, 56, 44, 62, 40, 60. What was the average number of cakes sold each day?
|
The average number of cakes sold each day was 45.5
|
|
|
A bakery sold the following number of cakes over the last 7 days: 22, 35, 56, 44, 62, 40, 60. What is the median of the data set?
|
The median is 44 cakes.
|
|
|
A bakery sold the following number of cakes over the last 7 days: 22, 35, 56, 44, 62, 40, 60. What is the range of the data?
|
The range of the data is 38
|
|

This plot shows the number of students in each teacher's class. How many total students are there total? (Each dot represents 1 student)
|
There are 30 students total.
|
|

The plot shows the number of students in each teacher's class. What is the mean (average) number of students in a class?
|
The mean number of students is 4.2 (4 would also be acceptable)
|
|
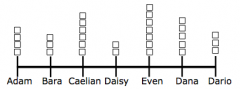
The plot shows the number of students in each teacher's class. What is the median number of students in a class?
|
The median number of students is 4.
|
|

The plot shows the number of students in each teacher's class. What is the mode for the data set?
|
The mode is 3.
|
|
|
The _______ for a data set is a measure of the center for that set.
|
The median (or mean) for a data set is a measure of the center for that set.
|
|
|
The median (or mean) for a data set _______ all of its values with a single number.
|
The median (or mean) for a data set summarizes all of its values with a single number.
|
|
|
A measure of _______ for a data set describes how the values in that data set vary with a single number.
|
A measure of variability for a data set describes how the values in that data set vary with a single number.
|