![]()
![]()
![]()
Use LEFT and RIGHT arrow keys to navigate between flashcards;
Use UP and DOWN arrow keys to flip the card;
H to show hint;
A reads text to speech;
17 Cards in this Set
- Front
- Back
- 3rd side (hint)
|
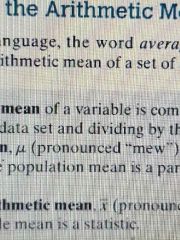
arithmetic mean |
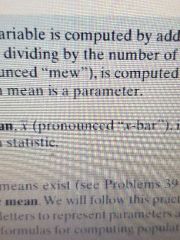
add all the values of the variable in the data set and dividing by the number of observations. |
|
|
|
population arithmetic mean |
is computed using all the individuals in a population. the population mean is a parameter. |
|
|
|
sample arithmetic mean |
is computed using sample data. the sample mean is a statistic. |
|
|
|
formulas for computing population and sample means |
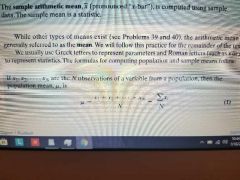
population mean |
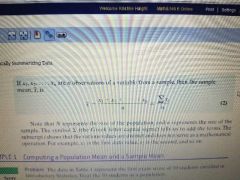
sample mean |
|
|
median |
of a variable is the value that lies in the middle of the data when arranged in ascending order. we use M to represent the median. |
|
|
|
resistant |
a numerical summary of data is said to be resistant if extreme values (very large or small) relative to the data do not affect its value substantially. |
|
|
|
mode |
of a variable is the most frequent observation of the variable that occurs in the data set. |
|
|
|
dispersion |
the degree to which the data are spread out |
|
|
|
range, R |
the difference between the largest and the smallest data value. |
Range=R=largest data value-smallest data value |
|
|
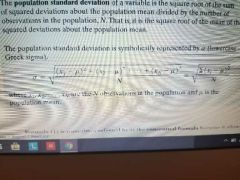
population standard deviation |
the square root of the sum of squared deviations about the population mean divided by the number of observations in the population , N. that is , it is the square root of the mean of the squared deviations about the population mean. |
|
|
|
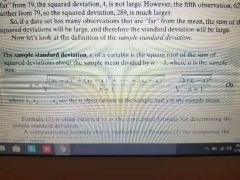
sample standard deviation |
s, the square root of the sum of squared deviations about the sample mean divided by n-1 , where n is the sample size. |
|
|
|
variance |
is the square of the standard deviation. the population variance is ó^2 and the sample variance is s^2 . |
|
|
|
class midpoint |
the sum of consecutive lower class limits divided by 2. |
|
|
|
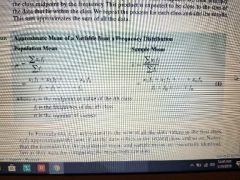
approximate mean of a variable from a frequency distribution |
|
|
|
|
weighted mean |
multiply each value of the variable by its corresponding weight, adding these products, and dividing this sum by the sum of the weights. |
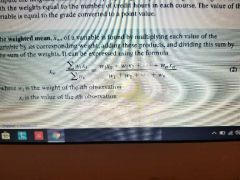
wi is the weight of the ith observation. xi is the value of the ith observation. |
|
|
approximate standard deviation of a variable from a frequency distribution |
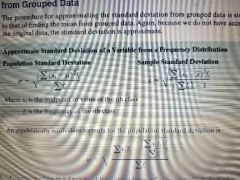
|
xi is the midpoint or value of the ith class fi is the frequency of the ith class |
|
|
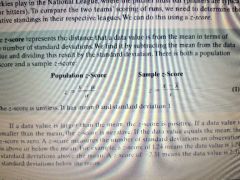
z-scores |
the distance that a data value is from the mean in terms of standard deviations . subtract the mean from the data value and divide the result by the standard deviation. |
|