Reading...
![]()
Play button
![]()
Play button
![]()
Use LEFT and RIGHT arrow keys to navigate between flashcards;
Use UP and DOWN arrow keys to flip the card;
H to show hint;
A reads text to speech;
191 Cards in this Set
- Front
- Back
|
Epidemiology: Definition
|
The study of the distribution (who, where and when) and determinants (risk factors) of health related to states and events in populations and the application of this study to the control of health problems.
|
|
|
Epidemiology Studies: Purpose
|
1. Elucidate etiology by combining epidemiologic (usually empirical) data with information from other disciplines such as genetics and microbiology.
2. To evaluate the consistency of epidemiologic data with etiologic hypothesis developed either clinically or experimentally. 3. To provide the basis for developing and evaluating preventative procedures and public health practice. |
|
|
Epidemiologic Reasoning
|
1) Determination of statistical association pattern between a group or individual characteristics and a disease or health condition.
2) The derivation of biological inferences from such a pattern of statistical associations. |
|
|
Assumptions for determining (inferring) Causation
|
1) statistical association between the E and D occurance
2) No temporal ambiguity: the E proceeds the D 3) No errors in estimating the effect of the E on the D; the observed association is NOT due to errors (confounding, selection, information bias) |
|
|
Strategies of Prevention:
Primary |
Type of intervention:
Modify the distribution of disease determinants in the population Goal of intervention: Prevent or postpone new occurrences of the disease. |
|
|
Strategies of Prevention:
Secondary |
Type of intervention:
Early detection of the disease (e.g.- screening to be followed by early treatment Goal of intervention: Improve the prognosis with early treatment |
|
|
Strategies of Prevention:
Tertiary |
Type of intervention:
treatment and rehabilitation Goal of intervention: Improve the prognosis with treatment and rehabilitation |
|
|
Natural History of Disease:
Understanding and Intervention levels |
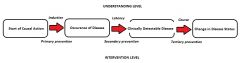
In practice, induction period is the period fro 1st Exposure and disease detection (usually combo induction and latency periods)
- Infectious disease: Incubation period (period from 1st exposure to disease detection) |
|
|
Unit of Analysis
(Methods of Observation) |
** The common level for which the sample size and data on all variables are reduced and analyzed
1) Individual: Individual participants in the study pop. 2) Sub-individuall: Organs (eyes, kidneys etc) 3) Group: An aggregation of individuals such as a geographic area, family unit, school, etc |
|
|
Source Population
|
The group of individuals who are eligible to be participants in the study
|
|
|
Study Population
|
Subjects that are in the study; they are eligible, informed, willing, at risk for the outcome. Those who are enrolled in the study.
|
|
|
Base Population
|
The population from which the study cases arise. Also known as the population at risk; subjects who if they developed the outcome would be cases in the study. In some studies the base population cannot be identified and in other studies it is the same as the study population.
|
|
|
Target Population
|
The population that the intervention is targeted for; results are generalized to.
|
|
|
Experimental Study Design: Definition
|
Scientist manipulates conditions to make the comparison groups equal except that one group has been assigned (usually randomly) to receive an experimental agent and the other group a placebo. Ex-Randomized clinical trials.
|
|
|
Experimental Design: Strengths
|
(randomized blinded placebo controlled clinical trial):
-Investigator has more control over the study conditions which MINMIZES bias -randomization reduces potential for confounding when the sample size is large; tends to produce groups with similar distributions of known and unknown confounders. - Randomization allows for the computed values of inferential stats to be defined in a probabilistic manner - Randomization also reduces the potential for selection bias. - Tests the safety and efficacy of an intervention; minimizes the pops exposure to an ineffective and/or harmful intervention - Since E is assigned, study can be replicated |
|
|
Experimental Design: Limitations
|
- Limited generalizability
- Can be impractical when the exposure is a behavior or environmental exposure - Sample size is usually small. - Lack of compliance and ethical issues possible |
|
|
Efficacy: Definition
|
whether or not the intervention has worked when applied in ideal situations (clinical trial)
|
|
|
Effectiveness: Definition
|
Whether the intervention has a beneficial effect under real world conditions in the target population; Does it work in real life?
|
|
|
Randomization: Definition
|
A random process by which each participant has a certain assigned chance (usually the same chance) of being assigned to the experimental or comparison group; compare with random sampling.
|
|
|
Randomization:
Purpose |
1) Reduce confounding- when sample size is large, makes groups comparable with regards to known and unknown risk or prognostic factors
2) Reduce selection bias 3) More appropriate for statistical testing |
|
|
Quasi-Experimental Design: Definition
|
An experiment where the subjects are non-randomly assigned to (or offered) the exposure. EX- Open trial; study of pets and blood pressure; offered a pet and accepts or refuses.
|
|
|
Quasi-Experimental Design: Strengths
|
1) Maybe more acceptable and ethical than a clinical trial
2) Reduces costs 3) Easier to recruit and carry out 4) More generalizability than clinical trials 5) Compared to observational, more control given to investigator over exposure |
|
|
Quasi-Experimental Design: Limitations
|
1) Treatment groups may not be comparable, doesn’t reduce or control for confounding
2) Doesn’t reduce for selection bias 3) Limited appropriateness for statistical tests |
|
|
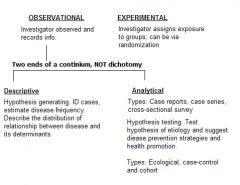
Observational Studies: Strengths
|
-less expensive
more feasible and practical -May be more ethical if the exposure may be harmful and already exists in the population -Usually conducted in larger pops, more generalizable Two types, descriptive and analytic. Are not dichotomous but instead two ends of a spectrum and therefore many studies have elements of both descriptive and analytic. |
|
|
Types of Observational Studies: Descriptive Studies
|
Description: Little is known about the occurrence or natural history of the determinants of disease.
Objective: ID cases, estimate disease frequency. The focus is on describing the distribution of diseases and it determinants. The who, where and when also known as hypothesis generating studies. |
|
|
Design Study Types
|
OBSERVATIONAL
Descriptive & Analytical EXPERIMENTAL |
|
|
Descriptive Studies: Data Purposes
|
1) The efficient allocation of resources to group or subgroups of the population that are most affected by the disease and targeting these groups for health education and prevention programs.
2) Describe patterns of disease occurrence allowing for the formulation of research questions or epidemiologic hypotheses. 3)First step in the identification of potential risk factors that can be altered or eliminated in an attempt to reduce or prevent disease. |
|
|
Types of Observational Studies: Analytical Studies
|
Description:
Enough is known about the disease so that a hypothesis can be tested. Objective: Test specific hypotheses of etiology and suggest disease prevention and health promotion. The focus is on testing hypothesis about the relationship between diseases and its determinants. |
|
|
Observational Studies:
Limitations |
-More bias
-less expensive - More difficult to replicate Two types, descriptive and analytic. Are not dichotomous but instead two ends of a spectrum and therefore many studies have elements of both descriptive and analytic. |
|
|
Selection of Subjects
|
- Restriction: Restrict eligibility or the source and study pops
- Sampling of the source pop: - Random - Stratified - Stratified Random |
|
|
Restriction: Definition
|
** Usually implemented for convenience/feasibility
Restriction (eligibility) of the source and study populations: Narrowing the eligibility of potential subjects by including or excluding individuals according to categories of variables like: - Extraneous risk factors for the disease - Medical tests or procedures that may influence the detection or diagnosis of disease -other diseases or conditions thought to be related to exposure status, time, place, major exposure variables (Selecting only persons who are heavily E or UnExp. |
|
|
Complete Restriction: Definition
|
Completely restricts the study population to those with the same value of factors known to affect the outcome Ex- all persons ages 40-50
Advantages: To control for extraneous factors, may be less costly/more feasible, reduce measurement error Limitations: Less generalizable |
|
|
Partial Restriction: Definition
|
Eligibility of potential subjects in one (comparison) group depends on the observations of certain variables in another (index) group
* the comp group is made similar (Matched) Advantages: To more efficiently control for extraneous factors in the analysis , may be more cost effective/feasible Limitations: May produce methodological problems, May be less generalizable |
|
|
Restriction: Advantages
|
1) To gain control over factors that could lead to bias
2)Complete: to control for extraneous factors, minimize selection bias, and misclassification bias, may be less costly and more feasible. 3) Partial (matching): to control for extraneous factors in analysis, may be less costly and more feasible. |
|
|
Restriction: Limitations
|
1) Complete: less generalizability
2) Partial: less generalizability may produce bias and reduce statistical and cost efficiency |
|
|
Simple Random Sampling
|
Selecting the subjects in a way to give each potential subject in the source population an EQUAL probability of being included in the study. Purpose: to make the study population representative of the source population (enhance generalizability).
|
|
|
Stratified Sampling
|
Independent selection of subjects from various mutually exclusive subpopulations (strata) of the source population. Often done to balance (equalize) the # of subjects or cases in different strata for which the #s are very unequal in the source population (ex- racial groups)
Can be defined by: known extraneous risk factors, effect modifiers, place, calendar time, major exposure variables, case-control sampling (disease). Purpose: to make the study more cost efficient and more statistically efficient overall or within a particular group |
|
|
Randomization Vs. Random Sampling
|
1) When: Random sampling occurs when a sample is chosen from a larger population at random. Randomization occurs when random assignment of the STUDY population to an exposure/intervention group.
2) Why: Random sampling occurs to make a sample more representative of the source population Randomization occurs to adjust for extraneous factors/minimize selection bias 3) Study Design: Random Sampling, can be applied to any study design. In randomization, only used in experimental designs like clinical trials. |
|
|
Methods of Observation
|
1) Type of Population- How participants or potential participants are observed during course of investigation (observation of subjects)
2) Type of outcome measure 3) Timing of measurement and study 4) Unit of analysis 5) Method of data collection |
|
|
Cross-Sectional
(Observation of Subjects) |
one set of observations are made at a single point in time (usually not the same calendar time)
|
|
|
Longitudinal
(Observation of Subjects) |
Observations are made at different times or continuously over a period of time in each individual in the population.
|
|
|
Fixed Cohort
|
When the study population and E is defined at baseline and there is no movement of praticipants between E groups nor new subjects into the coohort during a fixed follow-up time
Measure of D frequency: Risk, Measure of effect: risk ratio, risk difference |
|
|
Dynamic/Open Cohort
|
Where members of the study population and their E status can change over a variable follow-up time.
Measure of D frequency: rate (new cases/PT). Measure of effect: rate ratio, rate difference. Most cohort studies are dynamic. |
|
|
Cross-sectionally
(Measurement of Outcome) |
A state measured at “one point” in time
|
|
|
Longitudinally
(Measurement of Outcome) |
A change in disease/status over time measured:
Quantitatively: on a non-categorical scale like blood pressure or Qualitatively: on a categorical scale like smoker vs non-smoker |
|
|
Timing of MESUREMENT:
Purpose/Attributes |
- Assist in determining (inferring) that an E is a risk factor for a disease.
- Prospective data usually contain fewer measurement errors or missing values - May assist us in determining potential temporal ambiguity |
|
|
Timing of MEASUREMENT:
Prospective Vs. Retrospective (Methods of observation) |
** Refers to the chronological relation between the measurement of E or D status and the ACTUAL occurrence of these phenomena.
Prospective (concurrent): Both the CURRENT exposure status and CURRENT disease status are collected DURING the course of the investigation. Retrospective (non-concurrent): Both PREVIOUS exposure and PREVIOUS disease status are collected for a time PREVIOUS to the start of the investigation via recall or records Combination of the two occurs. Either the E or D measured prospectively |
|
|
Timing of STUDY:
Purpose/Attributes |
- Assist in determining (inferring) that an E is a risk factor for a disease
-Temporal ambiguity may exist when the study is retrospective - Measurement bias may occur if the diseases influences the measurement of E - Selection bias may occur if the D status influences the participation of E and non-E subjects differently or E status influences the participation of D and non-D subjects differently |
|
|
Timing of STUDY:
Prospective Vs. Retrospective (Methods of observation) |
** Refers to the chronological relation between the measurement of exposure and the disease status
Prospective:When the E is measured BEFORE the D/ outcome occurs; NO temporal ambiguity, here we know that E before D. Retrospective:When the E is measured AFTER the D occurs. |
|
|
Data Collection Methods
(Methods of Observation) |
Refers to WHO first collected the data and WHY they were collected
Primary and Secondary |
|
|
Primary Data
(Collection Methods) |
collected by the investigator for purposes of the study at hand; can be prospective or retrospective.
Main advantage: usually contains fewer measurement errors and missing values. |
|
|
Secondary Data
(Collection Methods) |
Originally collected by others for the purposes other than the objectives of the study at hand; can be prospective or retrospective.
Main advantage: Usually less expensive to obtain Limitations: -May contain measurement errors and missing values - May not be adequately powered to see effect - Sample size base on primary research objective. |
|
|
Observational Study Designs
|
Cohort, Cross-Sectional (prevalence study), Case-control
** Can be basic (as above), incomplete or hybrid ** |
|
|
Cohort Study: Definition
|
Selected subjects are free of the disease of interest and identified on the basis of exposure at the start of the study. A cohort is followed over time to measure the illness (or deaths) that occurred in exposed and non-exposed cohorts of subjects
** Good for rare exposures ** Can study several outcomes for each exposure |
|
|
Cohort Study: Elements
|
1. Unit of analysis: Individual
2. Population type: Longitudinal; fixed or dynamic 3. Base Population: Same as study population 4. Restriction: Complete 5. Data Collection: Primary and/or secondary 6. Timing of study: Prospective E before D 7. Timing of measurement: Prospective or retrospective; subjects selected BEFORE D occurrence or after. 8. Outcome Measure: usually incidence (preferred to eliminate temporal ambiguity) 9. Use: for rare E 10. Cost: Expensive/ more time consuming |
|
|
Cohort Study: Strengths
|
1) E measured before D
-reduce temporal ambiguity and differential misclassification of E (disease cannot influence measurement of E). 2) If subjects are selected before D, reduce selection bias 3) can study several Ds for each E. |
|
|
Cohort Study: Limitations
|
For rare D or E with LONG induction times can be expensive or time consuming; inefficient when the disease is rare (fewer disease so can reduce precision and can be costly to follow for rare disease. Also increase follow-up time needed )
Loss to follow-up can occur: (bias if D influences loss differently ofr E and non-E), reduce precision (increase with increased follow-up time needed) Information bias can occur if from secondary data source, selection bias can occur as missing data may be related to D risk and E (E data may have been more accurately collected for subjects with the disease outcome vs those without the disease outcome). |
|
|
Selection of Comparison Groups:
Goals in Cohort Study |
Main Goal: To select a comparison group which can estimate the counterfactual situation of the index group so that the effect estimate can be accurately measured.
Cohort Studies: - Non-E group with the same D frequency that E group would have experienced if the E were absent - Find a non-E group that is similar to E group with respect to imp predictors of D incidence independent of the E(ie- same background risk for the outcome). |
|
|
Retrospective Cohort Study:
Limitations |
(In addition to other limitations):
1) Information bias: From secondary data source if the original data collection protocol did not include the collection of the variables of interest. 2) Selection bias: Missing data may be related to D risk and the E |
|
|
Cross-Sectional Study (Prevalence Study): Definition
|
Field studies or prevalence surveys in which exposure and disease status are assessed simultaneously among individuals in a well defined population.
|
|
|
Cross-Sectional Study: Elements
|
1.Unit of analysis: Individual
2.Population type: cross-sectional 3.Base Population: may or may not be identifiable 4.Restriction: Complete 5.Sampling: Usually random 6.Data Collection: primary or secondary 7.Timing of study: Simultaneous 8.Timing of measurement: Retrospective; D and E usually measured AFTER D and E occurrence. 9.Outcome Measure: Prevalence 10.Use: Describe disease frequency and health needs of a population, Measure E-D associations to estimate E effect, screen new hypothesis (examine several E-D relationships in a population), often used to study biological characteristics that are: measured on a continuous scale, relatively frequent, have relatively long durations of expression, have a long latency period. |
|
|
Cross-Sectional (prevalence study): Example
|
Third graders divided into mothers who smoke and don’t smoke to assess asthma
|
|
|
Cross-Sectional (prevalence study): Limitations
|
* Temporal ambiguity can exist (did E before D?)
* measurement error (recall bias) * selection bias (disease status can influence section of subjects differently for toe E and non-E) * Risk factors cannot be distinguished from prognostic factors (since we do not know how long prevalent cases had the D. Increased disease among an exposed group may be consistent with the E lengthening the survival time or with the E being a risk factor for the disease outcome) * insufficient for the study of rare diseases with short durations |
|
|
Cross-Sectional (prevalence study): Strengths
|
* Inexpensive, not as time consuming
*can be used to describe a disease frequency and health needs of a population * can study several E-D relationships simultaneously to screen new hypotheses |
|
|
Basic Case-Control Study: Definition
|
Begin with a group of cases of a specific disease or condition, people w/out the disease or condition are selected as controls the study then seeks to compare the cases and controls with respect to their previous exposures. Because case-control studies look backward from effect to cause some investigators refer to them as retrospective studies
|
|
|
Basic Case-Control Study: Elements
|
1.Unit of analysis: Individual
2.Population type: Usually cross-sectional 3.Base Population: Usually NOT identifiable 4.Restriction: Either 5.Sampling: Cases and controls are sampled separately (stratified on D status) 6.Data Collection: primary or secondary 7.Timing of study: Retrospective- D status usually determined before E status is collected/determined. 8.Timing of measurement: Usually retrospective fro E and D 9.Outcome Measure: Prevalent or Incident 10.Use: Well suited for rare disease outcomes and diseases with long induction or long latent periods |
|
|
Basic Case-Control Study: Strengths
|
* Can provide estimate of effect for several E on a specific disease outcome
* more efficient study design vs cohort because smaller sample size, less expensive ad no follow-up time * Useful for rare disease outcomes and diseases with long induction or latent periods |
|
|
Basic Case-Control Study: Limitations
|
* NOT suited for:
-studying the effects of rare exposures -subjects with unknown disease status at the study’s start -continuous disease outcomes -obtaining descriptive information (when the base population is unknown) such as the incidence or prevalence of the disease -the distribution of the exposure or risk factors in the base population, etc. * Biases- selection bias, measurement error (especially if E measured retrospectively). Also, temporal ambiguity especially if E is measured prospectively. Selection and observation bias esp. recall bias are major problems. |
|
|
Case-Control Study VS. Cross-Sectional Study
|
* Case-control- Incidence or prevalence (cross-sectional- prevalence only)
*case-control- cases and controls are sampled separately (cross-sectional- subjects with and without the disease outcomes are sampled from the same source population) |
|
|
Population Based Case-Control Study: Definition
|
A case-control study conducted within a well-defined population / “cohort” (base population)
|
|
|
Population Based Case-Control Study: Elements
|
a: Unit of analysis: Individual
b.Population type: longitudinal (dynamic or fixed) or cross-sectional (can apply design to a cross-sectional pop) c. Base Population: Identifiable and complete d. Restriction: Either e. Sampling: Cases and controls are sampled separately f. Data Collection: primary or secondary g. Timing of study: Retrospective- D occurrence before E status is determined OR Prospective- E status is collected/determined before D occurs h. Timing of measurement: Prospective or retrospective for E and retrospective for D i. Outcome measure: incidence or prevalence |
|
|
Nested Case-Control Study: Definition and Info
|
* Benefits of using nested C-C study vs cohort: efficiency (time and money)
* Limitations of C-C vs cohort: if E information is collected after D occurrence (retrospectively) then it will be more susceptible to measurement error and temporal ambiguity. * Advantages of nested vs non nested C-C: -defined population (decrease selection bias) - information usually comparable decreasing differential misclassification -more likely to measure Incidence of D instead of prevalent cases (can estimate the effect of E on the D independent of duration of D) and less likely to have temporal ambiguity (if E collected before D occurred). |
|
|
Case-Control Study:
Goal of control selection |
* Select participants that would represent what the cases would look like if they didn't have the D
* You want to select controls so that their E represents the distribution of E in the base population @ time the D was identified (ie represents the population of those who if they had the disease would be cases in your study- the base population) |
|
|
Selection of Comparison Groups:
Goals in Case-Control Study |
Main Goal: To select a comparison group which can estimate the counterfactual situation of the index group so that the effect estimate can be accurately measured.
Case-Control: - Find non-D group that represents the E distribution of those who would be cases if diseased (base population). - Comparable accuracy (same recall etc) - controls identical to cases to factors that influence selection |
|
|
Control Sampling Types:
Cumulative Sampling |
Controls are selected randomly from all non cases at the END of the observational period.
USES: When the E does not change over time or the observation period is short or cross-sectional |
|
|
Control Sampling Types:
Density Sampling |
Also known as risk set sampling
*Controls are selected from all non-cases at the TIME the case is identified. NOTE: A control can later become a case USES: In a nested case-control study when the E changes over time, especially w/ a long observation period. |
|
|
Control Sampling Types:
Case-Base Sampling |
Also called case-cohort
* Controls are selected randomly at the start of follow-up (ie baseline or when someone enters the study) from a FIXED base population in a nested C-C study. NOTE: A control can later become a case. USE: In a nested C-C study when the effect of E on more than one disease of interest is examined simultaneously the same control group can be used for all comparisons |
|
|
Control Types:
Population |
Controls are sampled from same defined population as cases. Eg- controls from a C-C study nested within a cohort study,
|
|
|
Control Types:
Neighborhood |
Controls matched to case by neighborhood
USE: -when the base pop cannot be defined and identified ina precise way (ie a basic C-C design) - When nieghbors can represent E in the base population - May be conveneint and decrease cost Limitations: - Selection bias: a neighbrohood control may not represent E in the base pop. - Recall bias: Cases recall E info differently (usually more accurately) than controls |
|
|
Control Types:
Random-Digit Dialing |
Controls selected by randomly calling phone numbers
USE: - when the base pop cannot be defined and identified in a precise way - When having a telephone is an eligibility requirement for cases Limitations: - Recall bias - Selection bias- may not be motivated or be motivated due to E status. Over sample people with > 1 phone - Time consuming |
|
|
Control Types:
Hospital/Clinic/ Medical Practice |
Cases and controls from hospital-medical practice patients on basis of dx.
USE: - When cases are chosen from a hospital w/ a unknown catchment; ie- the base population is unknown - Decreases recall bias, comparable to quality of info - Decrease cost; inconvenience Limitations:- Selection bias: If control disease groups is related to the E then controls will not represent E in the base pop. |
|
|
Control Types:
Friends/Relatives |
Use: - Convenience
- May decrease response/ recall bias (similar motivation) - May be more likely to participate regardless of their E status Limitations: - Selection bias: may not represent E in base pop, may be too sililar to case with respect to E, bias toward null, if being extroveted (froiendly?) is related to E. |
|
|
Control Types:
Dead |
USE: - When use proxy respondents of cases
- Convenience Limitations: - Differential misclassification if info is not obtained in the same manner - Selection bias- may not represent E in the base pop. IF related to controls death. |
|
|
Types of Ecologic Measures (3)
|
* Aggregate (summary measures) - proportion infected with H. pylori, rate of gastric cancer
*Environmental (physical characteristics of a place)- air pollution levels, average rainfall a year. *Global- (characteristic of the group)- education system, healthcare system |
|
|
Ecological Study: Definition and Uses
|
A study where the unit of analysis is the group and we do not know the joint distribution of the E/D.
Uses: When individual E cannot be measured accurately (ex environmental E), when it is not feasible to obtain E status and D status, to screen etiologic hypotheses, to generate new etiologic hypotheses and to evaluate interventions or policies applied to groups (social epi). Strengths: - Inexpensive and feasible (Useful for evaluating effectiveness of interventions applied to groups. Limitations: - Ecological bias - Information bias ** Incomplete obs. study** |
|
|
Types of Ecologic Studies (4)
|
* Exploratory
* Multiple group ecologic * Time trend studies * Mixed design |
|
|
Space/Time Cluster Study: Definition
|
Directly observed information is generally missing on E. Typically the presumed E is an infectious agent or environmental factor that may not be clearly specified.
** Incomplete Obs study** |
|
|
Family-Cluster Studies: Definition
|
Directly observed information is generally missing of E. Typically, the presumed E is a genetic susceptibility, where the specific genotype is not identified.
** Incomplete Obs study** |
|
|
Hybrid Observational Studies: Info
|
Many types: population based case control, case cross-over, two stage sampling, etc
|
|
|
Random Error: Definition
|
* Lack of precision in measurement of the effect
* Random Error reduced via having a larger sample size and increasing stat efficiency via restricting, balancing, using all info on each variable and certain mathematical assumptions |
|
|
Non-Random (Systematic) Error: Definition
|
* Due to lack of validity (BIAS)
|
|
|
Sources of Bias (3)
|
3 sources of reduced internal validity:
* Selection bias * Information bias * Confounding |
|
|
Precision: Definition and Info
|
Precision indicates that the info was collected, calcuated correctly and is precise in estimating a population paramaeter
* Concordance or % agreement * Precision indicated by a narrow CI (small variance) * Precision does NOT imply estimate valid. *Can have measurement of effect that is valid but imprecise * Can increase precision via increase sample size, study efficiency |
|
|
Validity: Definition and Info
|
* A valid estimate is one that is expected to represent (aside from random error) perfectly the TRUE value of the desired population parameter in the entire base population.
* Does not imply precision. |
|
|
Estimation VS Measurement Validity
|
Estimate Validity: An estimate that represents the ture value of the pop parameter in the entire base pop aside from random error.Does NOT imply precision
* Measurement validity: High sensitivity and High specificity. Does not imply reliablity. |
|
|
Sensitivity: Definition
|
* True positives among those with the disease or outcome.
* A/A+C |
|
|
Specificity: Definition
|
* True negatives among those without the disease or outcome
* D/B+D |
|
|
Positive Predictive Value (PPV): Definition
|
* True positives among those with the exposure
* A/A+B |
|
|
Negative Predictive Value (NPV): Definition
|
* True negatives among those without the exposure
* D/C+D |
|
|
Generalizability: Definition
|
* Requires internal validity; it is more important to be guided by the need to make internally valid comparisons rather than having a study population representative of a population outside the source population.
|
|
|
Internal (simple) Validity: Definition
|
Validity of inferences pertaining to the base population. Valid measurement of effect for the base pop, no biases
3 Biases that reduce internal validity: 1) Selection Bias 2) Information Bias 3) Confounding |
|
|
External Validity: Definition
|
Validity of inference to people outside the source population. Requires internal validity.
* More imp for epi studies to be guided by need for internal validity than having representativeness outside of source population |
|
|
Direction of Bias: Definition
|
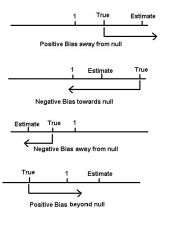
Where the estimated measure of effect (estimate of causal parameter) lies in relation to the causal parameter.
|
|
|
Selection Bias: Definition
|
Systemic error in the estimate of effect that stems from:
- Procedures used to select subjects - Factors that influence study participation |
|
|
Selection Bias:
When does it occur? |
Trial/Cohort Sutdy:
Generally if the disease influences how study subjects are chosen or participate in a study and therefore the index and comparison groups are not equivalent in terms of exposure. Case/Control: -The exposure influences how study subjects are chosen or participate in a study and therefore the index and comparison groups are not equivalent in terms of disease. -Either in a cross-sectional study - more likely to occur when base population is not identifiable. |
|
|
Selection of Comparison groups- GOAL:
|
To select a comparison group which can estimate the counterfactual situation of the index group so that the effect estimates can be accurately measured.
|
|
|
Selection Bias: Cohort Studies
|
-Non-E group with the same D frequency that E group would have experienced if the E were absent
-start with the base population and follow-up; Find a non-E group that is similar to the E group with respect to important predictor of disease incidence independent of the E (ie same background risk for the outcome) -comparable accuracy: the D should be equally detected/ measured in the E and non-E groups. ** Selection bias less likely since E before D. |
|
|
Selection Bias: Case-Control Studies
|
Find non-D group that represents the E distribution of those who would be cases of D (base population); control should be identical to cases with respect to uncontrolled factors that influence selection; comparable accuracy, ex same recall of E etc.
|
|
|
Selection Bias Vs. Lack of Generalizability
|
Selection bias- depends on how subjects are selected/ participate; reduces internal validity.
Lack of Generalizability- does not affect internal validity; may be due to effect modification, the true E-D differs among eligible subjects (the source population) and an outside population. |
|
|
When does selection bias occur?
|
* Cohort/Clinical trials: less likely since E occurs before D
* Case Control studies: More likely to occur when controls are not representative of the BASE population; of cases are not representative of cases in the source population * ALL studies including cross-sectional: source population doesn’t necessarily = base population but depends on specific D and E being studied. |
|
|
9 Types of Selection Bias
|
1) Selective loss to follow-up
2) Selective Survival/Migration 3) Detection Bias 4) Diagnosis Bias 5) Reporting Bias 6)Self-selection Bias 7) Healthy Worker Effect 8) Berkson's Bias 9) Inclusion/selection Bias |
|
|
Selective loss to follow-up (Selection Bias)
|
Bias resulting when study participation due to loss to follow-up, non-response or non-participation is associated with:
- Disease in a trial or cohort study differently E (Tx) and non-E (nonTx) groups - Exposure in a C/C study differently for cases and controls |
|
|
Selective Survival/Migration (Selection Bias)
|
Bias that occurs in a study with a prevalent outcome when there is:
- loss of POTENTIAL subjects (due to association w/ exposure) BEFORE selection AND -this loss of subjects differs for the outcome (D) and comparison (Non-D) groups. |
|
|
Detection Bias (Selection Bias)
|
Bias that occurs from the disproportionate search for disease (through routine medical surveillance) due to the E or correlates of E in a case-control study.
- For a case-control study detection bias can occur in the absence of disease misclassification and/or the exposure affects the detection and selection of subjects differently for cases and controls. **In a trial, cohort or cross-sectional study this is NOT detection bias but misclassification (information) bias. |
|
|
Diagnosis Bias (Selection Bias)
|
Bias that occurs when different diagnosis criteria are used in the E vs. non-E.
-In a case-control study the E affects the diagnosis and selection of subjects differently for cases and controls. ** In a cohort study this is a differential misclassification (information) bias. |
|
|
Reporting Bias (Selection Bias)
|
Bias that occurs when the E affects the reporting of diagnosed cases of a disease.
-In a case-control study the E affects the reporting and selection of subjects differently for cases and controls. **In a cohort study this is a differential misclassification (information) bias. |
|
|
Self-Selection Bias (Selection Bias)
|
Bias that occurs when:
- Cohort studies- study self-selection results in differences between E groups regarding risk for D or outcome. -Case-control- E status affects study self-selection differently for D and non-D groups. - Either case can happen in cross-section studies. |
|
|
Healthy Worker Effect (Selection Bias)
|
Bias that occurs when E workers are compared to non-E workers.
-Since Workers tend to be healthier than those not working therefore this method of selection results in a difference in D risk for the E groups. -So, not working is a correlate of disease that influences selection differently for the E and non-E groups - can also occur when comparing E groups based on occupation, specific job, US general pop etc. |
|
|
Berkson’s Bias (Selection Bias)
|
Bias occurring in case-control & cross-sectional studies when:
-the study population is composed of patients - the probability of being hospitalized (or included in the study population) and selected depends on the disease status AND exposure status. |
|
|
Berkson's Bias-
Minimal when: |
- The probability of being selected from the base population among
1) the cases 2) the controls AND 3) the exposed are independent (DO NOT influence each other AND - the probability of being hospitalized (or being a patient) and then selected is about the same for potential cases and controls OR -The probability of being hospitalized (or being a patient) for exposed persons w/out the case or control disease is small (<5%) |
|
|
Inclusion/selection Bias
(Selection Bias) |
Bias that occurs when there is a difference in inclusion/exclusion criteria in:
-cohort study: Correlates of D influence inclusion/exclusion of the E -case-control study: -controls not representative of base population -systemic inclusion/exclusion of subjects with other diseases known to be associated with the E -correlates f the E influence inclusion/exclusion of cases and controls differently AND having the index D affects the occurrence of the excluded diseases -OR the index and control D groups have 1+ risk factors in common besides the E -OR the excluded disease are risk factors for the index disease |
|
|
How to Deal with selection bias?
|
1) Planning:
- use incidence not prevalence data, -use same selection procedures/ eligibility criteria for all groups - use 2+ control groups (each may be biased) -use same diagnostic procedures and screening procedures for all groups -sample controls randomly from a defined base population nested or population based design 2) Collection: -min. loss to follow-up, non-response etc. -make sure the disease is diagnosed blind to E status. 3) Analysis: -control for it (usually can’t) - compare non-responders to responders -try to estimate direction and magnitude of bias. |
|
|
Information Bias
|
Bias occurring due to errors in the measurement of or collection of data which then distorts the estimate of effect (RR, OR etc).
|
|
|
Three sources of Information Bias
|
1) Misclassification (differential and non-differential): categorical/ Discrete variables
2) Regression to the mean: continuous variables 3) Ecological Bias: Average measurement |
|
|
Misclassification (information) Bias
|
Occurs when there is an error in the measurement of a categorical/discrete (ex no. of children) exposure, outcome and/or covariate variable which then distorts the estimate of effect.
Two main type of misclassification occur:Differental and non-differential |
|
|
Differential (misclassification) Bias
|
Occurs when the accurate measurement of a discrete or categorical variable (se or Sp) for D (or E) is not independent of E(or D) and therefore leads to a distorted estimate of effect.
Can be minimized by using the same methods of obtaining E (D) for D and non-D (E (Tx) and non-E (Tx)). |
|
|
Differential Bias:
Cross-sectional/Cohort or clinical trials |
occurs as bias resulting from the disproportionate search for disease due to E or correlates of the E. Includes:
1) Detection bias 2) Diagnostic Bias 3)Reporting Bias |
|
|
Detection bias
(Information Bias- Differential Misclassification) |
E groups are subjected to different surveillance for disease detection
|
|
|
Diagnostic bias-
Information Bias (Differential misclassification) |
D diagnosis is influenced by the clinician’s knowledge of the subject’s E status or the level of related variables
|
|
|
Reporting Bias
Information Bias (Differential Misclassification) |
reporting of the D status is different for the E groups). Note difference with selection bias
|
|
|
Differential Misclassification Bias:
Case/control or cross sectional |
occurs when the classification of E is different for D and non-D subjects.
Includes: Recall/Response Bias |
|
|
Recall/Response Bias
|
(Occurs when cases are more likely to recall or report the true level of a previous exposure compared to controls
-could also occur if the cases are less likely to correctly recall or report the E. (especially sensitive E- "Response bias" |
|
|
Recall/Response Bias:
Direction of bias |
When cases recall E information more accurately than controls:
- If E is causal: -and controls under report E, then the bias is (+) away from the null - and controls over report E, then bias is (-) towards the null - IF E is protective: - and controls under report E, then bias is (+) towards null -and controls over report E, then bias is (-) away from null |
|
|
Non-differential (Misclassification) Bias
|
A distortion in the estimate of effect resulting when the amount of misclassification of the D (or the E) is the same for all categories of the E (or D).
|
|
|
Information Bias:
Non-Differential Misclassification Direction |
Usually bias towards the null
- can lead to bias away from or beyond null when: - the amount of misclassification is extreme (when Se (+) Sp<1) can lead to bias beyond the null OR - The misclassification of E and D are not independent OR - The variable being misclassified is not binary |
|
|
Non-Differential Misclassification:
Magnitude in fixed Cohort/trial |
- Even modest misclass. can lead to substantial bias
- Amt of bias is influenced more by Sp (specificity) than Se (Sensitivity) - RR (not RD) is unbiased if Se<1 and Sp=1 - Est RR= 1 if Se + Sp=1 regardless of true RR (bias beyond the null if Se+Sp,1) - Non-diff misclass. of E and D results in more bias than does misclass of D or E |
|
|
Non-Differential Misclassification:
Magnitude in a Case-Control Study |
- Even modest misclass. can lead to substantial bias
- Misclass of D affects selection, so misclass of D in a C/C study does not equal to misclass of D in the base - When Sp=1 (bias if Se<1) - Est RR=1 if Se+Sp=1 regardless of true RR (bias beyond the null of Se+Sp<1) - Non-diff misclass of E and D results in more bias than the same misclass for only D or E |
|
|
Non-differential Misclassification:
Bias towards the null |
- Bias towards null is not serious concern when the estimated effect is stron and we are trying to assess etiology
- Can be serious problem when the estimated effect is incorrectly null |
|
|
Non-differential Misclassification:
When does it lead to unbiased estimates? |
- No other errors in estimation have occurred AND
- we are estimating a causal RR with a RR (vs a RD) AND - In a cohort study or trial- perfect specificity ie, all non-D are correctly classified |
|
|
Non-differential Misclassification:
When can it lead to bias AWAY from or Beyond the null? |
- Not independent of other errors
- Extreme - E or D misclass is not binary |
|
|
Misclassification (information bias):
How to minimize |
- Prevent: Improve measurement methods
- Correct: Difficult and often inadequate (especially for confounders) |
|
|
Non- differential Misclassification:
Correction problems |
1) Assumes no other error in estimation
2) Assumes D and E misclassification is independent; usually cannot check this assumption 3) Assumes the misclass. is non-diff (we may not know this) 4) When then study is NOT a fixed cohort study we need to know the Se and Sp of the measure in the Study pop (which may not equal the base pop in a C/C study) 5) For a fixed cohort study: we need the Sp and Se or PV (+) in E and unE |
|
|
Misclassification of Confounders:
Effect |
- Reduces the ability to control for confounding
- Bias in either direction - Residual confounding |
|
|
Regression to the mean (Information Bias)
|
The tendency for the value of a continuous variable that is measured with error and is extreme on its first measurement to be closer to the center of the population distribution on a later measurement. Bias results when subjects are selected/participate due to their initial extreme value therefore changes due to regression to the mean man get confused with true changes in the underlying factor.
|
|
|
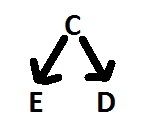
Confounding
|
- confusion between the effect of the E of interest on D and the effect of another factor
- Discrepancy between the unobservable counterfactual risks or rates and the risk or rates used as a substitute |
|
|
Confounding: 3 Main Sources
|
1) Causal or proxy associations between the confounder and the E and D in the base population
2)selection bias 3) methods of data collection, subject classification and data analysis (e.g.- matching w/out a matched analysis in a C/C study |
|
|
Confounding: 3 Criteria
|
1) The confounder predicts/explains the outcome in the unexposed base population. Basically the confounder is an independent risk factor for D.
2)The confounder is associated with E in the BASE POPULATION. 3)Association of the confounder with the E is not ENTIRELY due to the effect of the E on the confounder (not is the same causal pathway). |
|
|
Confounding:
Assessment |
1) Prior knowledge of E, C, D relationship
2) Counterfactual consideration- comparability 3) Statistical considerations- collapsability. Confounding may NOT be present when: - Stratum specific estimates are similar to each other - Stratum specific estimates approximate summary estimates of effect - Adjusted estimate of effect approximate summary estimates of effect 4) DAG- Directed Acyclical Graphs 5) Issues of study design- Randomization, sample size, blinding |
|
|
When to control for a confounder
|
Control for a confounder when either:
1) meets all 3 criteria via a priori knowledge OR 2) Selection confounding was introduced (ex- matching in case-control studies when the Covariate is associated with the E in the source population) AND 3) Confounding still exists after simultaneous relations between multiple covariates are evaluated and the most parsimonious accurate model is specified (eg- other variables in the same causal pathway have NOT been controlled for). |
|
|
When can a change in the estimate of effect (crude or adjusted) be used to assess confounding instead of prior information?
|
1) When there is inadequate a priori info regarding criteria 1 and 2 OR
2) The data is too spares to include all potential confounders in a model AND the covariate is NOT an intermediate. For adjusted, the estimate for the measure of effect changes by >10% after controlling for the factor |
|
|
What does the magnitude of the confounding depend on?
|
1)Randomized trials without selective loss to follow-up: sample size. As the size increases the potential for confounding decreases
2)Observational studies: strength of the confounder’s association with D and E NOT size. **NOTE: Hypothesis testing for associations (C-D and E-C) does depend on sample size and will NOT necessarily reveal confounding in observational studies. |
|
|
What does the direction of the confounding depend on?
|
1)Positive bias: if both the E-D and C-D relationship are in the same directions.
2)Negative bias: if the E-D and C-D relationships are in opposite directions |
|
|
Selection Confounding:
Definition and Study Types |
Confounding that is due to the manner in which subjects were selected.
- Cohort Study: When subject selection creates an association between the E and C in the base population, even when E and C are not related NOTE: Subject selection can also eliminate a C-E association in the base population, preventing it from being a confounder - Case/Control: Matching can introduce confounding if it makes C related to D, even if D is NOT a risk factor for the D |
|
|
Confounding by Indication:
Definition |
- Relevant to observational studies when the E is a Tx or an intervention
- Refers to the presence of an extraneous determinant of the outcome if a precieved high risk or poor prognosis is an indication for Tx. - Indication is strictly defined as a disease. Not to be confused with protopathic bias, confounding by severity or selection bias |
|
|
Confounding by indication:
Fxn and Consequence |
- The indication is a confounder because it correlates with the Tx (E) and is a risk indicator for the illness (D).
- Confounding by indication undermines comparability between groups |
|
|
Confounding by Indication:
Solutions |
- Confounding by indication requires statistical adjustment and may be addressed using:
- Conventional multivariable regression with a variable defined for the indication - Propensity scores - Instrumental variable analysis |
|
|
Causal confounding
|
confounding that is entirely due to the casual effects between C, E and D in the BASE population.
|
|
Proxy confounder
|
A variable, C, that is associated with a causal confounder, U, and is in ALL the causal pathways with U and D.
|
|
Partial proxy confounder
|
A variable, C, that is associated with a causal confounder, U and is NOT in all the causal pathways with U and D.
* We should control for a partial proxy if you cannot control for the causal confounder |
|
|
Dealing with confounding:
Prevent it by: |
1) randomization- As N increases the probability that groups will be identical w/regard to confounders (known/unknown) increases,
2) restriction- confounding cannot exist of the variable only has one category (or is homogeneous) 3) Matching- Can prevent confounding in SOME cohort studies (rarely) |
|
|
Dealing with Confounding: control via analysis
|
1) Stratified analysis
2) Add to a model |
|
|
Confounding Control: Stratified analysis
|
1.Stratification: Analysis of data within categories of covariates (potential confounders).
a. Used to: i. Show effect modification ii. Preliminary analyses: 1st look at measured associations in the study population iii. Analysis controls (or adjusts) for confounding by: having making all subjects being compared have the same confounder value |
|
|
Confounding Control: Matching
|
Matching: The purpose is to control confounding more effectively by trying to balance the ratio of comparison: index subjects across strata of the matching variable
a. Individual : One or more comparisons are selected for each index b. Frequency: The total comparison group is selected so that the distribution of matching variables is similar to the distribution of the entire index group. Preferred. c. Fixed-ratio: Ratio si the dame for all matched sets d. Variable-ratio: Ratio of comparison to index subjects varies among matched sets |
|
|
Regression to the mean
(Regression Dilution) |
the tendency for the value of a continuous variable that is measured with error and is extreme on its first measurement to be closer to the center of the population distribution on a later measurement.
- Selection bias can result when subjects are selected/ participate due to their extreme value. -Confounding can occur when changes due to regression to the mean get confused with true changes in the underlying factor. |
|
|
Regression to the mean: prevention/reduction
|
-Randomize individuals to E and non-E groups OR
- use average measures(obtain on several diff days at baseline and follow-up) OR - use an eligibility measure and a separately measurde (on a different day) for the baseline value OR - adjust for the baseline measure. |
|
|
Ecological Bias:
Definition |
Ecologic fallacy- Using evidence from studies using gropu (pops) as the unit of analysis to erroneously make causal inferences at the individual level
|
|
|
Ecological Studies:
When is there no ecological bias? |
- When there is not w/in groups bias in ANY group due to selection bias, misclass., and confounding
- No ecologic correlation (linear association across groups) between the % E and the disease risk in the nonE pop - RD at the individual level is constant across all groups |
|
|
Protopathic Bias:
Definition |
Diagnosis, symptoms, signs precursors of disease or increase risk for disease leads to a change in the E of interest (the E is usually a drug or Tx)
|
|
|
Effect Modification
|
Measure of effect changes with differing levels of another exposure. Measured by statistical interactions. Important because:
1.Determine which analysis to use 2.Variable selection 3.Operationalize hypotheses 4.Generalizing results **Stratifying by EM is the BEST: IF not and just report common effects of homogeneity= misleading results. |
|
|
What is the difference between EM and confounders
|
1.Fundamental: Confounding is BIAS. EM is an interesting result to be reported
2.Analysis: confounding is the difference between crude and adjusted effects. EM is differing measures of effects between groups. |
|
|
Measures of Disease Frequency
|
Reflect the occurrence of the disease population. Used to describe the health status of a population, predict the occurrence of a disease in a population and derive other measures
|
|
|
Common Measures of Disease Frequency
|
1) Counts
2) Ratios 3) Proportions 4) Rates 5) Incidence |
|
|
Counts
|
Simple enumeration of events.
|
|
|
Ratios
|
Value obtained by dividing one quantity by another. The numerator is NOT necessarily included in the denominator.
|
|
|
Proportions
|
Value obtained by dividing one quantity by another. The numerator is ALWAYS included in the denominator. Proportions can be expressed as a percentage.
|
|
|
Rates
|
An expression of the frequency with which an event occurs in a defined population at a given moment or interval in time usually multiplied by a constant such as the power of 10. The numerator consists of the frequency of a disease over a specified period of time (ex- number of deaths in a given year) and the denominator is a unit of size of population (ex- reference population during the midpoint of the year). Rates differ from proportions because the denominator involves a measure of time. Rates are ALWAYS ratios BUT some can be proportions.
|
|
|
3 catagories of rates
|
1) Crude
2) Specific 3) Adjusted |
|
|
Rates: Crude
|
ummary rates based on the actual number of events in a population over a given time period. Ex. Crude death rate and birth rate. Limitations of a crude rate such as sex or age distributions and influence crude rates therefore caution should be used in making comparative statements about disease frequencies in populations.
|
|
|
Rates: Specific
|
Refer to a particular subgroup of the population defined in terms of sex, age, race etc. or may refer to the entire population but be specific for some single cause of death or illness. Specific rates include incidence and prevalence
|
|
|
Rates: Adjusted
|
Summary measures of the rate of morbidity or mortality in a population in which statistical procedures have been applied to remove the effect of differences in composition of the various populations. Age is a common factor for rate adjustment. Adjusted rates are FAKE rates and are only good for comparisons and only with other populations that used the same standard population. There are two methods for rate adjustment, referring to the source of the rates: Direct and Indirect
|
|
|
Adjusted Rates: Direct
|
Requires the application of the observed rates of disease in a population to some standard population to derive an expected number (rate) of mortality (ex.- killing people in 1940 at the 1980 rate). By standardizing the observed rates of disease in the population being compared to the same reference population, on is thereby assured that any observed differences that remain are not simply a reflection of differences in population structure with respect to factors such as age, race and sex. The direct method may be used if age specific death rates in a population to be standardized are known and a suitable standard population is available.
|
|
|
Adjusted Rates: Indirect
|
Does not require knowledge of the actual age-specific incidence or mortality rates among each age group for the population to be standardized. May be used if age-specific death rates of the population of standardization are unknown or unstable (ex. Because the rates to be standardized are based on a small population).
|
|
|
Incidence
|
Refers to the development of NEW cases of the disease or condition in previously disease free or condition free individuals in a given time.
Cohort Studies and Clinical trials use incidence. |
|
|
Prevalence
|
Presence of a disease or condition at "one point" in time, in a population includes new and previous existing cases.
Cross-Sectional and case-control studies use prevalence |
|
|
Cumulative Incidence
|
Can calculate the cumulative incidence in the exposed, unexposed and total population.
|
|
|
Risk Difference or Attributable Risk
|
Measures the ABSOLUTE difference between the incidence in the exposed minus the incidence in the non-exposed. Cumulative Incidence in the exposed – Cum. Incidence in the unexposed.
|
|
|
Attributable Risk in the Exposed
|
(AR% or AFE): The proportion of the exposed cases attributable to the exposure OR % of exposed cases that would NOT have occurred in the absence of the exposure
|
|
|
Population Risk or Population Attributable Risk
|
The absolute difference between the incidence in the TOTAL population and the incidence in the non-exposed.
|
|
|
Attributable Fraction in the Total population or (PAR% or AF)
|
The proportion of ALL cases in the total population that were attributable to the exposure; the % of all cases in the total population that would not have occurred in the absence of the exposure.
|
|
|
Incidence Density: Definition and Study Type
|
(Density Cohort Study) The rate of disease occurrence in the exposed group in total person-time of observation. The main difference from cumulative incidence is the use of person-time and approaches incidence more closely.
|
|
|
Incidence Density: General Rules/Info
|
1) We use SE instead of SD because we are using samples not total population
2) IDD~ causal rate difference and the IDR~ causal rate ratio in a dynamic cohort when the E groups are comparable 3) Density OR ~ Density RR without the rare disease assumption |