![]()
![]()
![]()
Use LEFT and RIGHT arrow keys to navigate between flashcards;
Use UP and DOWN arrow keys to flip the card;
H to show hint;
A reads text to speech;
23 Cards in this Set
- Front
- Back
|
Cumulative Incidence |
CI = # new cases of disease during specified time period / # people in at-risk population at beginning of time period "The 10-day cumulative incidence of disease is ___%." - Technically proportion (not rate) - Estimates the probability (risk) that a person will develop disease during a specified time - Assumes entire pop is followed entire time |
|
|
Attack Rate |
# new cases of disease / total pop. at risk for a ‘limited’ period of observation "The 1-day cumulative incidence of disease is ___%." - Technically proportion (not rate) - Type of CI measure - Useful when observing outbreak (often due to very specific exposure) |
|
|
Case-Fatality Rate |
Number of deaths from disease / # cases of that disease in specified time period "The 10-day cumulative incidence of disease is ___%." - Type of CI measure - Reflects severity of disease |
|
|
Incidence Rate |
IR = # new cases disease during specified time period / total at-risk person-time of observation "The incidence rate of disease is ___ per 100,000 PYs. (can use 100, 1000, 1,000,000" - pay attention to what PY you are using - True rate (not proportion) - a.k.a. "incidence density" - more accurate b/c doesn’t rely on same assumptions as CI (more accurate rep of real world scenarios |
|
|
Mortality Rate |
total # deaths / total person-time of follow-up - Not true rate b/c didn't follow all 231 mil ppl for full year (see ex in slides) - Can be cause-specific or age-specific, depending on what you're observing |
|
|
Prevalence |
P = # of existing cases of disease at a specified time / total # of people in population at that time "The prevalence of disease in the specified population is ____%." - Estimate of probability that a person in a population has a disease at a specified time - Proportion (not rate) - can be Point (at 1 specified time) or Period (over certain period of specified time) |
|
|
Birth defect rate |
# children born with defects / total # of births - type of point prevalence (probability at specific time of birth - 1 point in time) |
|
|
Cumulative Incidence & Incidence Ratio (their relationship) |
CI ≈ IR x time period - Relationship between CI and IR - Only holds for small CI (<10%). - Also assumes population is fixed. - % |
|
|
Point Prevalence & Incidence Ratio (their relationship) |
P / (1-P) = IR x D P ≈ IR * D (when prevalence is low, disease is rare, <10%) - D=avg duration of disease; IR=incidence rate; P= POINT prevalence - Assumes incidence and duration constant over time (steady state) - If incidence is low but duration is long, means point prevalence is high relative to incidence - If incidence is high but duration is short, means point prevalence is low relative to incidence - Changes in prevalence can be due to changes in duration or incidence or both - % |
|
|
Age-adjusted rate |
∑(age-specific rate * adjustment weight) - forces weighted average of each age group to equal that of the general pop for each observed subgroup |
|
|
Risk Difference |
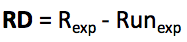
"The excess risk during the ___ period of x disease among the exposed group is ___%." - how much greater is the risk of outcome if you're exposed than if you're not exposed - (i.e. if RD=0, exposure has no effect on outcome) - a.k.a. cumulative incidence difference, incidence rate difference, and prevalence difference |
|
|
Excess Number of Cases |
RD x number exposed "The excess number of cases that is associated with the exposure is ____ [e.g. 117.78]." - What numbers of the disease outcome are due to being exposed |
|
|
Population Risk Difference (1) |
!["The excess risk of [disease] for the total population is ___%."
- 1st population risk difference formula
- Rtot = risk of total pop; Runexp = risk among unexposed
- i.e. PRD will be low if exposure is rare](https://images.cram.com/images/upload-flashcards/09/36/54/20093654_m.png)
"The excess risk of [disease] for the total population is ___%." - 1st population risk difference formula - Rtot = risk of total pop; Runexp = risk among unexposed - i.e. PRD will be low if exposure is rare |
|
|
Population Risk Difference (2) |
!["The excess risk of [disease] for the total population is ___%."
- 2nd population risk difference formula
- Pexp_tot = proportion of tot pop that's exposed](https://images.cram.com/images/upload-flashcards/09/37/17/20093717_m.png)
"The excess risk of [disease] for the total population is ___%." - 2nd population risk difference formula - Pexp_tot = proportion of tot pop that's exposed |
|
|
Attributable Proportion of Exposed (1) |
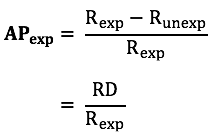
"___% of [disease] cases that occurred among [exposed group] is associated with them being [exposed]." - Rexp = risk (IR, CI) among exposed - Runexp = risk (IR, CI) among unexposed - a.k.a. etiologic fraction, attributable risk percent, attributable risk percent among exposed |
|
|
Attributable Proportion of Exposed (2) |
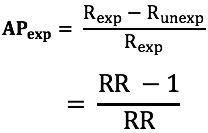
"___% of [disease] cases that occurred among [exposed group] is associated with them being [exposed]." - Useful when you only have RR (not the factors that make up RR) |
|
|
Attributable Proportion of Total Pop. (1) |
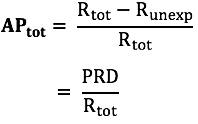
"___% of cases that occurred in the total population are associated with being [exposed]." - Rt = risk (IR, CI) among total population - Ru = risk (IR, CI) among unexposed |
|
|
Attributable Proportion of Total Pop. (2) |
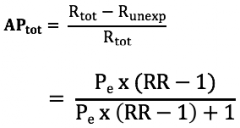
"___% of cases that occurred in the total population are associated with being [exposed]." - Pe = proportion of total population that is exposed. Useful when you only have RR, but must have Pe too. |
|
|
Relative Risk |
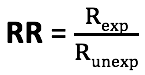
"If you are [exposed], you are ___ [i.e. 17..33] times as likely as a [non-exposed] to develop [disease]." - Tells you how many times higher or lower the disease outcome is among the exposed compared to the unexposed - Based on ratio of 2 measures of frequency - Tells us magnitude or strength of association - dimensionless (no units) and ranges 0 to infinity - RR=0 => no assoc - RR>1 => exposed have > risk than unexp - RR<1 => exposed have < risk than unexp |
|
|
Put RR into a % |
RR = (RR-1) x 100 "[Exposed] are ___% more likely to develop [disease] as [non-exposed]." |
|
|
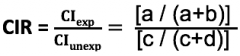
Cumulative Incidence Ratio |
|
|
|
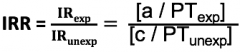
Incidence Rate Ratio |
|
|
|
Prevalence Ratio |
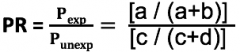
- Not considered measure of relative risk - Dr. Niccolai said she probably won't test this one |