![]()
![]()
![]()
Use LEFT and RIGHT arrow keys to navigate between flashcards;
Use UP and DOWN arrow keys to flip the card;
H to show hint;
A reads text to speech;
24 Cards in this Set
- Front
- Back
|
what the Dow Jones Industrial Average is and what it means |
The Dow Jones Industrial Average is a price-weighted average of 30 significant stocks traded on the New York Stock Exchange and the Nasdaq. The DJIA was invented by Charles Dow back in 1896. So, basically, the Dow is just a quick summary of the current value of shares of thirty large companies. It’s a predictor of the general direction of the economy over the next year or so. |
|
|
what the different stock indexes mean |
- The Standard & Poor's 500 Stock Index is a larger and more diverse index than the DJIA. Made up of 500 of the most widely traded stocks in the U.S., it represents about 70% of the total value of U.S. stock markets. In general, the S&P 500 index gives a good indication of movement in the U.S. marketplace as a whole. Because the S&P 500 index is market weighted (also referred to as capitalization weighted), every stock in the index is represented in proportion to its total market capitalization. In other words, if the total market value of all 500 companies in the S&P 500 drops by 10%, the value of the index also drops by 10%. The S&P 500 index includes companies in a variety of sectors, including energy, industrials, information technology, healthcare, financials and consumer staples. - The Wilshire 5000 is sometimes called the "total stock market index" or "total market index" because almost all publicly-traded companies with headquarters in the U.S. that have readily available price data are included in the Wilshire 5000. Although it's a near-perfect measure of the entire U.S. market, the Wilshire 5000 is referred to less often than the less comprehensive S&P 500 when people talk about the entire market. - Most investors know that the Nasdaq is the exchange on which technology stocks are traded. The Nasdaq Composite Index is a market-capitalization-weighted index of all stocks traded on the Nasdaq stock exchange. This index includes some companies that are not based in the U.S. - The Russell 2000 is a market-capitalization-weighted index of the 2,000 smallest stocks in the Russell 3000, an index of the 3,000 largest publicly-traded companies, based on market cap, in the U.S. stock market. The Russell 2000 index gained popularity during the 1990s, when small-cap stocks soared and investors moved more money to the sector. The Russell 2000 is the best-known indicator of the daily performance of small companies in the market; it is not dominated by a single industry. |
|
|
The Lorenz Curve |
A graphical representation of wealth distribution developed by American economist Max Lorenz in 1905. On the graph, a straight diagonal line represents perfect equality of wealth distribution; the Lorenz curve lies beneath it, showing the reality of wealth distribution. The difference between the straight line and the curved line is the amount of inequality of wealth distribution, a figure described by the Gini coefficient. The Lorenz curve can be used to show what percentage of a nation's residents possess what percentage of that nation's wealth. For example, it might show that the country's poorest 10% possess 2% of the country's wealth. |
|
|
The Laffer Curve |
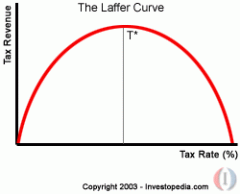
this curve shows the relationship between tax rates and tax revenue collected by governments. The curve suggests that, as taxes increase from low levels, tax revenue collected by the government also increases. It also shows that tax rates increasing after a certain point (T*) would cause people not to work as hard or not at all, thereby reducing tax revenue. Eventually, if tax rates reached 100% (the far right of the curve), then all people would choose not to work because everything they earned would go to the government. |
|
|
Determinants of labor supply and what makes the labor supply curve shift |
Shifts of the curve arecaused the following determinants of Labor Supply: - Tastes (for leisure, income, work) When leisure is more popular, the curve shifts left (the opposite is true). - Income and wealth (Recall the Income Effect) As people become wealthier or paid more, there is less need to work, and the curve shifts left (the opposite is true). Less labor is supplied if income from government relief increases, the curve shifts left (the opposite is true). - Expectations (For income or consumption) If you expect that income will decrease, you may want to supply less of your time to the labor market, thus the curve shifts left (the opposite is true to a point). If you expect that you will do less consumption you may want to supply less of your time to the labor market, thus the curve shifts left (the opposite is true). Less labor is supplied if income from government relief is expected to increase, thus the curve shifts left (the opposite is true). - Prices (of consumer goods) If you expect consumer prices to fall, you may want to supply less of your time to the labor market, thus the curve shifts left (the opposite is true). - Population If there is a decline in population, the curve shifts left (the opposite is true). - Taxes High taxes may make you want to supply less of your time to the labor market, thus the curve shifts left (the opposite is true). - Employer Incentives Flexibility in hours Day Care Telecommuting availability |
|
|
Demand for labor, its determinants, its elasticity, its equilibrium and also theopponents of minimum wage |
- Demand for Labor is based upon demand or expected demand for the employers’ goods and services, thus it's derived demand.Its other determinants are: The number of employers The marginal revenue product (see below) of labor in firms and industries - Equilibrium also becomes a factor in this market, just as it does for goods and services. Just as there iselasticity of supply in goods and services, there is also that effect in labor supply. - It differs between people of given current income levels,age groups and need for job security and seniority, especially if you’re trying to lure a worker from another firm or a competitor. - Minimum wages (Only effects firms doing business on an interstate level). Will often reduce the quantity of labor demanded (it will also compel employers to generate more productivity out of workers through technology) Increase the quantity of labor supplied. Can create a market surplus, thus a higher unemployment rate due to more actively seeking work Those who have opposed it have not necessarily been opposed to the cause of the worker, especially if lawmakers believe that it is rising too quickly. |
|
|
The effect of Minimum wages |
- Minimum wages (Only effects firms doing business on an interstate level). Will often reduce the quantity of labor demanded (it will also compel employers to generate more productivity out of workers through technology) Increase the quantity of labor supplied. Can create a market surplus, thus a higher unemployment rate due to more actively seeking work Those who have opposed it have not necessarily been opposed to the cause of the worker, especially if lawmakers believe that it is rising too quickly.
|
|
|
The value of added workers |
Each identical worker isworth no more than the marginal revenue product of the last worker hired.
|
|
|
The choice between inputs vs. processes that are either labor intensive or capital intensive |
Typically, employers don’t choose between individual inputs as much as they choose between production processes that are either labor intensive or capital intensive.M
|
|
|
The efficiency decision |
Efficiency Decision – The choice of a production process for any given rate of output.
-The efficiency decision requires a producer to choose that production process that minimizes costs for any particular rate of output.
|
|
|
Closed Shop |
Firms can only hire you ifyou agree to belong to the union (Outlawed in 1947 to give “right-to-work”opportunity) but it still exists
|
|
|
Union Shop |
You can be hired without agreeing to join the union, but you must join within a specified time (which ultimately has the same effect as a closed shop)
|
|
|
Agency Shop |
Workers don’t have to join the union, but must pay dues if it is believed that said workers benefit from the union’s negotiation.
|
|
|
Open Shop |
Workers decide if they join union and if not, they pay no dues
|
|
|
Maintenance of membership |
Non union workers negotiateown wages etc
|
|
|
what unions seek |
Unions seek all of the following
· Higher wages · High benefits · More involvement in a firm’s decisions · Better working conditions
|
|
|
what is considered an unfair labor practice? |
You cannot engage inunfair labor practices, which include
· Failure to bargain in good faith · Threatening lower pay or layoffs if aunion is voted into your firm · Intimidation of those trying to organizeor maintain union activities
|
|
|
How disputes about unfair labor practices are settled |
Disputes about unfair labor practices are taken up with the National Labor Relation Board.The Taft Hartley Act created a balance, giving rights to employers.
|
|
|
Unions affect on their industries |
Unions tend to make it so that industries using many union workers have higher labor costs Workers displaced from the unionized market often seek work in non-unionized markets, thereby shifting the nonunion supply of labor curve to the right
|
|
|
What happens to workers displaced from the unionized market |
Workers displaced from the unionized market often seek work in non-unionized markets, thereby shifting the nonunion supply of labor curve to the right
|
|
|
Who suffers in labor/management impasses over contracts |
in labor/management impasses over contracts, usually both labor and management will suffer when work stoppages exist.
|
|
|
The Wagner Act |
Also known as the National Labor Relations Act, this bill was signed into law by President Franklin Roosevelt on July 5, 1935. It established the National Labor Relations Board and addressed relations between unions and employers in the private sector.
|
|
|
The Taft-Hartley Act |
The Labor Management Relations Act of 1947 - restricts the activities and power of labor unions. The Taft–Hartley Act amended the National Labor Relations Act (NLRA; informally the Wagner Act). added a list of prohibited actions, or unfair labor practices, on the part of unions to the NLRA, which had previously only prohibited unfair labor practices committed by employers. The Taft–Hartley Act prohibited jurisdictional strikes, wildcat strikes, solidarity or political strikes, secondary boycotts, secondary and mass picketing, closed shops, and monetary donations by unions to federal political campaigns.
|
|
|
Executive Order 10988 |
executive order issued by President John F. Kennedy on January 17, 1962 that recognized the right of federal employees to collective bargaining. This executive order was a breakthrough for public sector workers, who were not protected under the 1935 Wagner Act. Executive Order 10988 was effectively replaced by President Richard Nixon's Executive Order 11491 in 1969. Union membership among federal employees increased several times over in the next decade. This effect boosted even longstanding federal unions
|