![]()
![]()
![]()
Use LEFT and RIGHT arrow keys to navigate between flashcards;
Use UP and DOWN arrow keys to flip the card;
H to show hint;
A reads text to speech;
62 Cards in this Set
- Front
- Back

Flow in MV will move... |

Toward transducer (above baseline) Biphasic |
|
Flow in TV will move.... |
Toward (above baseline) Biphasic |
|
Flow in LVOT/ AOV will move...
|
Away ( below baseline) Bullet shaped |
|
Flow in RVOT/ Pulmonary Valve will move.... |
Away (below baseline) Bullet shaped |
|
Abnormal MV |
Mitral Regurge: Away ( below baseline /aliasing) Mitral Stenosis: toward ( above baseline) |
|
|
MV can be seen in |
A4, A2, or subcostal |
|
|
TV can be seen in |
A4 or RVIT |
|
|
LVOT can be seen in |
A5 or A3 |
|
|
AOV can be seen in |
A5, A3, or supra sternal |
|
|
RVOT can be seen in |
RVOT or PSSA AOV |
|
|
Pulmonic artery can be seen in |
RVOT or PSSA AOV |
|
|
Pulmonary vein can be seen in |
A4 |
|
|
Tissue Doppler can be seen in |
A4 |
|
|
RV pressure |
Systole: 15-30 (mean 20)Diastole: 2-8 (mean 4) |
|
|
RA pressure |
"A" and "V" wave: 2-10Mean: 2 -8 |
|
|
LA / pulmonary capillary wedge pressure |
Mean: 2-12"A" and "V" wave: 3 - 15Diastolic mean: 1-10 |
|
|
Pulmonary Artery pressure |
Systole: 15 -30 (mean 10-20)Diastole: 4 -12 Mean: 10-20 |
|
|
Systemic arterial pressure |
Systole: 100- 140 (mean 80-130)Diastole: 60 -90Mean: 70-105 |
|
|
MV peak velocity range |
0.6 - 1.3 m/s Mean: 0.9m/s |
|
|
TV peak velocity range |
0.3-0.7 m/s Mean: 0.5m/s |
|
|
LVOT velocity range |
0.7 -1.1 m/s Mean: 0.9 m/s |
|
|
RVOT/ PULM. VALVE velocity range |
0.6 - 0.9 m/sMean: 0.75 m/s |
|
|
Bernouli's equation |
4(V)^2 |
|
|
Velocity time interval (VTI) |
-measures mean velocity -calculates mean pressure gradient. Units: mm/s or cm/s |
|
|
AOV velocity range |
1.0 - 1.7 m/s Mean: 1.35 m/s |
|
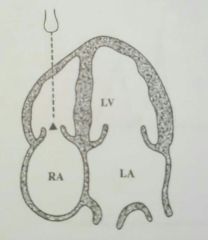
Abnormal TV |
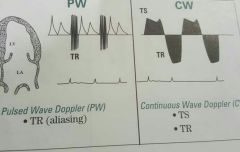
Tricuspid Stenosis: toward (above baseline) Tricuspid Regurge: Away (below baseline/ aliasing ) |
|
|
Abnormal LVOT/ AORTA |
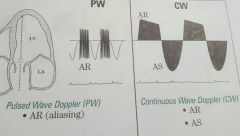
Aortic regurge: toward ( above baseline/ aliasing) Aortic stenosis: Away ( below baseline) |
|
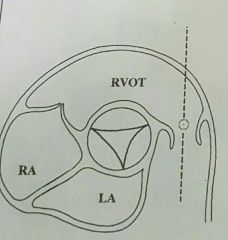
Abnormal RVOT/ PULMONARY VALVE |
Pulmonic regurge: toward ( above baseline/ aliasing) Pulmonic stenosis: Away ( below baseline) |
|
|
PSLA RVIDd range (Right ventricle in diastole) |
1.9 - 3.8 cm |
|
|
PSLA IVS/LVPW range |
0.6 - 1.0 cm |
|
|
PSLA LVIDd range ( left ventricle in diastole) |
3.9- 5.9 cm |
|
|
PSLA LVIDs range (Left ventricle in systole) |
2.1-4.0 cm |
|
|
PSLA LAs range (Left atrium in systole) |
2.7-4.0 xm |
|
|
MV Color Dopple flow |
Red with yellow at MV tips |
|
|
TV Color Doppler flow |
Red at leaflet tips |
|
|
LVOT/ AOV Color Doppler flow |
Blue with aliasing to yellow, orange and red |
|
|
RVOT/ PULMONARY VALVE Color Doppler flow |
Blue with aliasing to yellow, orange and red |
|
|
MV flow is in ... |
Diastole |
|
|
TV flow is in... |
Diastole |
|
|
LVOT/AOV flow is in... |
Systole |
|
|
RVOT / PULMONARY VALVE flows in... |
Systole |
|
|
SVG of AOV is placed |
1 cm into aorta |
|
|
SVG in MV is placed |
1-2 cm above leaflets |
|
|
SVG of RVOT is placed |
1-2 cm above PV |
|
|
Setting of SVG |
4-6mm < 0~ 20° |
|
|
What is Variance? |
Turbulence - when many velocities exist |
|
|
Variance is present |
-stenosis -regurgitation -septal defects |
|
|
Tissue Doppler Imaging (TDI) |
Detects heart wall movement - seen at A4 at lateral & sepetal annulus |
|
|
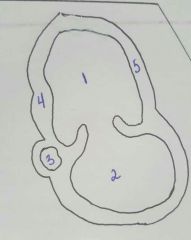
Apical 2 1. LV 2. LA 3. Descending thoracic aorta (DTA) 4. Inferior wall 5. Anterior wall |
|
|
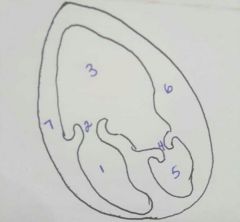
Apical 3 1 . LA 2. MV 3. LV 4. AOV 5. Aorta 6. IVS 7. Posterior wall |
|
|
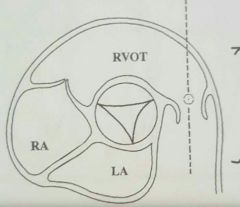
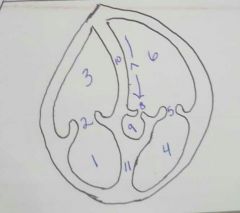
Apical 5 1. RA 2. TV 3. RV 4. LA 5. MV 6. LV 7. LVOT 8. AOV 9. AORTA 10. IVS 11. IAS |
|

|
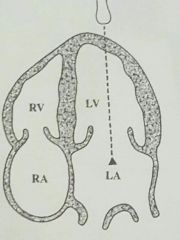
Apical 4 1. RA 2. TV 3. RV 4. PV 5. LA 6. MV 7. LV 8. Lateral wall 9. Anterolateral wall 10. IVS 11. IAS |
|
|
Red / blue blood flow means |
Laminar flow |
|
|
Green blood flow means |
Non laminar flow |
|
|
Yellow / white blood flow means |
Increase velocity in RBC |
|
|
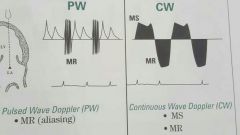
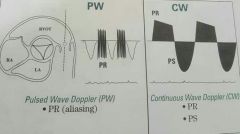
Pulse waved Doppler ( PW) |
-used to obtain a transvalvular velocity -site specific / SVG - has aliasing - nyquist limit= 1/2 PRF - has window |
|
|
Continous wave Doppler (CW) |
-no depth info -> no 2-D image -no window |
|
|
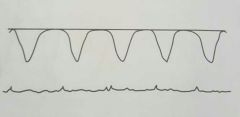
On the EKG systole is at |
Q-T |
|
|
On the EKG diastole is at |
T-Q |
|
|
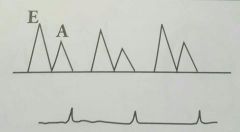
E point |
Rapid ventricular filling |
|
|
A point |
Atrial contraction |
|
|
Pulmonary vein labeling on QRS |
AR: off P wave S: off Q D: off T |