Reading...
![]()
Play button
![]()
Play button
![]()
Use LEFT and RIGHT arrow keys to navigate between flashcards;
Use UP and DOWN arrow keys to flip the card;
H to show hint;
A reads text to speech;
71 Cards in this Set
- Front
- Back
|
Business Cycle - Long Run: Price, Y and Employment
|
LR: Price is flexible; Y & employment are at "natural" levels
|
|
|
Business Cycle - Short Run: Price, Y, and Employment
|
P is "sticky"
shocks and shifts push Y & employment away from natural levels |
|
|
Business Cycle: Shape of AD, LRAS and SRAS curves
|
AD slopes down
LRAS is Vertical SRAS is Horizontal |
|
|
Shocks to AD or AS cause---
|
fluctuations in GDP and employment
|
|
|
How are fiscal and monetary policy used?
|
to stimulate or stablize the economy
|
|
|
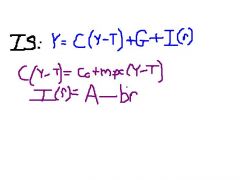
The Goods market -->
|
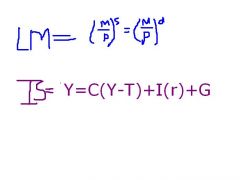
IS (investment-saving) curve
Y=C+G+I (Closed Economy -- NX = 0) |
|
|
The money market -->
|
LM (liquidity-money) curve
|
|
|
Definition of IS curve
|
Y-r combinations where Goods Market is in equilibrium
|
|
|
Define Keynesian Cross
|
the equilibrium where output = expenditure (Y=E)
|
|
|
planned expenditure
|
income, how much money able to spend
|
|
|
Draw the basic graph for the Keynesian Cross
|
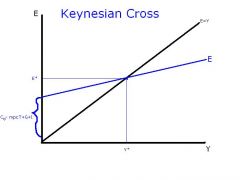
2 equations:
1.) E = Co - mpcT + G+ I + mpcY slope = mpc 2.) E=Y (m=1) |
|
|
Using the Keynesian Cross; how can we rewrite the equation to solve for Y in terms of Eo?
|
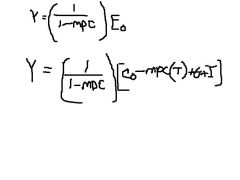
derived from original equation E=Y=C+G+I
|
|
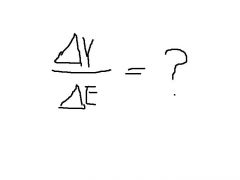
How does output change from a change in Eo?
|
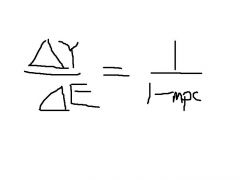
(1/1-mpc) = Eo multiplier
|
|
|
How does a change in Co, G, or I affect Eo?
|
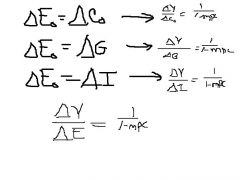
Any change in Co, G, or I changes Eo by the same amount
|
|
|
Causes of increase in G, Co, I (real life)
|
increase in G --> Govt spending
increase in Co--> consumer confidence increase in I --> interest rate |
|
|
Effects of change in T(taxes) on Eo?
|
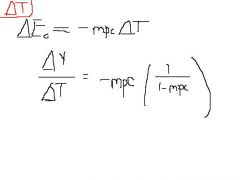
Any change in T changes Eo by negative marginal propensity to consume X change in T
(taxes cause consumers to spend less but not dollar for dollar) |
|
|
What is the relationship of I and I(r)?
|
Negative relationship between I and I(r)
(Change in I shifts E curve up if positive, down if negative) |
|
|
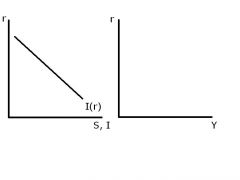
Graph I as a function of r
|
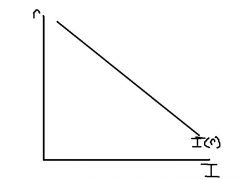
Given an equation:
Example: I(r) = 1000 - 100r |
|
|
Graph changes in Y, E, and I when r (interest) goes up
KEYNESIAN CROSS |
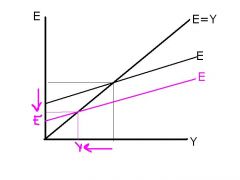
if interest goes up then Y decreases, E decreases, I decreases
|
|
|
Graph a basic IS curve
|
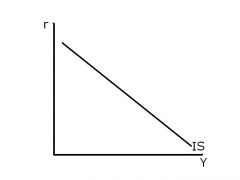
downwards sloping, relates Y to r
|
|
|
Graph change in IS when G increases
|
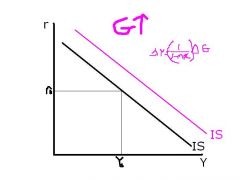
Shifts to the right
|
|
|
Graph changes in IS when T increases
|
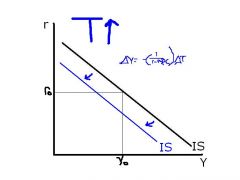
shifts to the left
|
|
|
Graph changes in IS curve when r increases
|
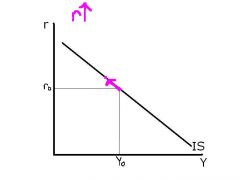
move along curve up and left (NO SHIFT)
|
|
|
What is the equation for IS curve
|
Y as a function of r
|
|
|
Equations for LM curve
|
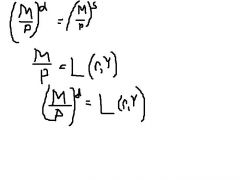
LM Curve is a function of Y, r
|
|
|
IS curve: when Y increases, what happens to S? (if mpc<1)
|
As long as mpc<1 then as Y increases, S increases
Derive the IS curve from the market for loanable funds (Saving = Investment) |
|
|
What is the LM curve?
|
The Money Market
Y-r combinations where real money market is in equilibrium (P fixed) |
|
|
Real money supply with LM curve
|
Vertical line; P is fixed and M is fixed
|
|
|
Real Money Demand
|
Money Demand = L(r) for a given Y
|
|
|
Properties of Real Money Supply Curve = M/P (M, P fixed)
|
1. P is fixed ("sticky")
2. M is fixed at M, money supply exogenous 3. At any interest rate, the real money supply is the same --> 4. (M/P)s is a vertical line |
|
|
Properties of (M/P)d = L(r)
|
r is the cost of holding money, so as r increases money demanded decreases (for a given Y); downwards sloping
|
|
|
Properties of the LM curve
|
Relationship between r and Y where Real Money supply = Real Money Demand
Set of Y-r pairs where money market is in equilibrium Upward sloping |
|
|
Show effects of increase of money demand on LM curve
|
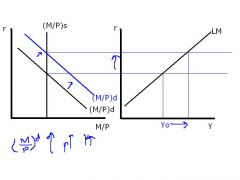
increase in real money demand forces the interest rate up, increase in Y
|
|
|
Equations for both the IS and LM curve
|
IS curve: Goods Market Equilibrium
LM curve: Money Market Equilibrium |
|
|
Effect of increase in capital for individual?
|
Population increase causes loss of capital/investment for individual person since the wealth has to be shared amongst other workers
|
|
|
Graph the changes to consumption and steady state capital due to an increase in population
|
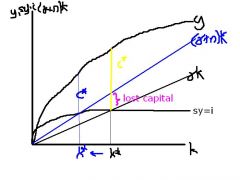
increase in population leads to a decrease in both capital and consumption and output
|
|
|
what is the equation for change in k (solow growth)
|
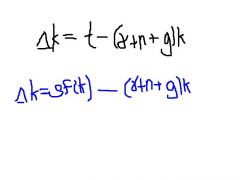
output - decrease in capital (depreciation, pop growth, growth rate)
|
|
|
what is the total GDP growth rate equal to?
|
g + n
(each worker is getting more effective, there are more of each of these workers) |
|
|
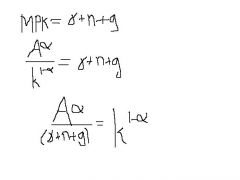
how do you find the steady state?
|
i = outflow
sf(k) = (&+n+g)k |
|
|
Equation for steady state using production function and how changes in variables effect k*
|
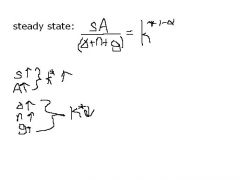
Note that per worker production function y = f(k) = Ak^(alpha)
|
|
|
Golden Rule (equations)
|
golden rule: optimize over the steady state consumption
|
|
|
What is the growth rate and technological progress rate at the steady-state?
|
At the steady-state, the per “effective worker” growth rate is zero. Technological progress rate is positive (g)
GDP per worker growth rate is technological progress rate, g>0, population growth rate is positive (n) |
|
|
What is money?
|
Stock of assets that can be readily used to make transactions.
|
|
|
Function of Money (3)
|
1. Medium of exchange (transactions--replaces barter)
2. Unit of account (measures value; goods and services measured in $) 3. Store of value |
|
|
2 types of money
|
1. Fiat money "paper money"
2. Commodity Money; money that has value itself (gold, cigarettes) |
|
|
C =
(Money) |
Currency
|
|
|
M1 =
|
Currency, Demand Deposits, Travelers Checks, Other Checkable Deposits
|
|
|
M2 =
|
M1, Savings Deposits (inc. MMDA), Small Time Deposits, MM Mutual Funds (retail)
|
|
|
M3=
|
M2, Large Time Deposits, Repurchase Agreements, Eurodollars, MM Mutual Funds (institutional)
|
|
|
What is V?
(Money) |
Velocity: Number of times the Average dollar changes hands in a given period
|
|
|
Quantity Theory of Money/Quantity Equation
|
M x V = P x Y
|
|
|
Money Supply (equation)
|
M = C + D
Money = currency + deposits |
|
|
Monetary Base = ?
(formula) |
B = C + R
Monetary Base = Currency + reserves |
|
|
100 Percent Reserve Banking
|
All deposits held in a bank must be kept in the bank (reserves) available for withdrawal; no loans
|
|
|
Fractional Reserve Banking
|
Some fraction of deposits is kept in the bank (reserves) available for withdrawal; balance is loaned out. Consider this repeated in multiple banks
|
|
|
T = ?
|
Transactions: Total value of transactions
M x V = T (Note: Transactions is "similar" to nominal GDP) |
|
|
m = ?
|
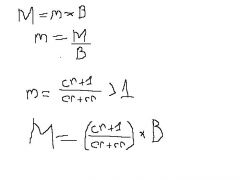
monetary base
|
|
|
What is the effect of a decrease in the reserve ratio on the monetary base and money supply?
|
decrease in reserve ratio is an incrase in money supply
|
|
|
What is the effect on MS when you buy bonds?
|
increases the quantity of money (--> Drives down the interest rate)
|
|
|
What is the effect on MS when sell bonds?
|
decreases the quantity of money (M/P)s curve shifts to the left)
|
|
|
3 types of monetary policy
|
1. reserve requirements
2. Open Market Operations 3. Discount Rate |
|
|
Open Market Operations (OMO)
|
buy and sell govt bonds (type of monetary policy)
|
|
|
Discount rate
|
Interest rate charged by fed. reserve for loans to banks
(type of monetary policy) |
|
|
Does Money Supply depend on the interest rate?
|
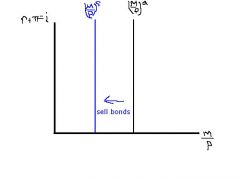
No, that's why the MS curve is vertical because it is independent of the interest rate
|
|
INflation rate =?
|
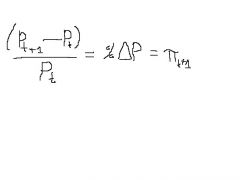
Inflation rate measures the % increase in the price index per period
|
|
|
Fisher equation for nominal interest rate and real interest rate
|
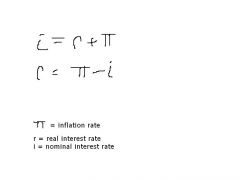
nominal = real + inflation
|
|
|
What is the rltnsp between real money demanded and the interest rate?
|
Negative relationship between real money demanded and interest rate
positive relationship to Y |
|
|
Money Demand = ? (In terms of nominal interest rate)
|
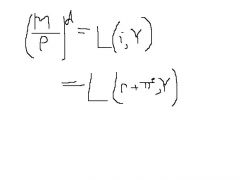
Money Demand depends on interest rate and Y
|
|
|
What is the Money Supply and Money Demand Equilibrium?
|
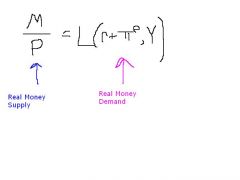
.
|
|
|
Summary of LR Business Cycle Theory
|
Prices Adjust, changes in Demand cause immediate changes in prices, leaving output and income unchanged at F(K, L)
|
|
|
Summary of SR Business Cycle Theory
|
Prices are "Sticky", changes in Demand do not move prices so inventories fluctuate causing production changes
|