Reading...
![]()
Play button
![]()
Play button
![]()
Use LEFT and RIGHT arrow keys to navigate between flashcards;
Use UP and DOWN arrow keys to flip the card;
H to show hint;
A reads text to speech;
11 Cards in this Set
- Front
- Back
|
How is a primary neoplasm different from a secondary neoplasm?
|
Primary = tumor from the cell of origin (and in that area)
Secondary = metastases |
|
|
In terms of "mass effect", what does a vasogenic edema or tumor do?
|
Vasogenic edema will PUSH on things, distorting their shape and/or location.
|
|
|
In terms of "mass effect", what does gliosis do? While you're at it, what's a gliosis?
|
Gliosis is scarring of glial cells.
They tend to PULL on things |
|
|
What's a duret hemorrhage?
|
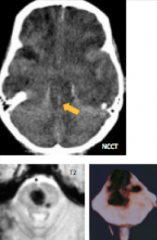
Duret hemorrhages are a bad sign. They result from central tentorial herniations --> bleeding into the brainstem. Check it out (yellow arrow).
|
|
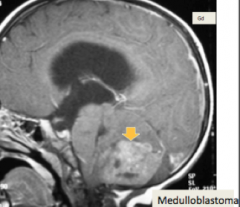
What's this tumor (medulloblastoma) doing in terms of mass effect?
|

It's pushing up! The ventricles are all squished and dilated. On an axial section, the ventricles look very enlarged and dilated. This here is a saggital view, but you can see that the ventricles have been pushed up.
|
|
|
Do tumors have higher or lower cell density? How does this show up on a no-contrast-CT (NCCT)?
|
Higher cell density and increased % mitoses.
On NCCT, you will notice a hyperdense area (brigther) |
|

Is this a normal or abnormal MR-spectroscopy? How do you know?
|
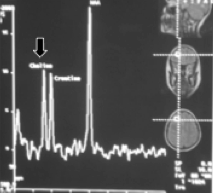
That's a normal one. Notice the 3 peaks:
- Choline - Creatine - NAA |
|
|
For MR-Spectroscopy, what do these peaks represent?
1. Choline 2. Creatine 3. NAA |

1. Choline is a MEMBRANE MARKER (# cells)
2. Creatine is a METABOLISM MARKER 3. NAA is a NEURONAL MARKER (# neurons) |
|
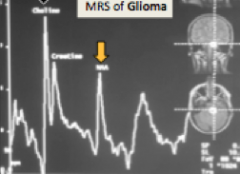
This is an abnormal MRS. How do you know (ignore the label)?
|

The peaks are going down "stock market crashing".
Choline is higher --> hypercellular NAA is lower --> fewer neuronal |
|
|
In tumors, do you have higher or lower capillary density? What image can show this the best?
|
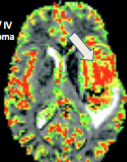
You have increased relative blood volume supplying that area. Can be seen on MR-Perfusion Weighted Imaging.
|
|
|
Why do tumors have areas of necrosis? How can this be measured by spectroscopy?
|
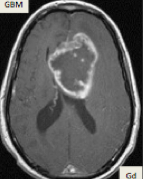
The cells grow so fast they outgrow their blood supplying, leaving a necrotic core.
On spectroscopy, this can be seen with a LACTATE PEAK, which represents anaerobic glycolysis. On a contrast-enhanced MRI (Gd), you will see a rim-enhancement pattern. |