Reading...
![]()
Play button
![]()
Play button
![]()
Use LEFT and RIGHT arrow keys to navigate between flashcards;
Use UP and DOWN arrow keys to flip the card;
H to show hint;
A reads text to speech;
8 Cards in this Set
- Front
- Back
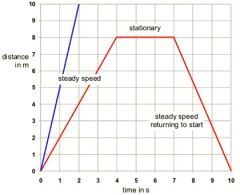
What are distance time graphs
|
Describe the motion of an object. They show how the distance moved from a starting point changes over time.
|
|
|
What are the x and y axis?
|
x = distance (check units) and y = time (check units)
|
|
|
What does the gradient represent?
|
The gradient is speed (how fast it is going)
|
|
|
What are flat sections?
|
Flat sections are when object has stopped
|
|
|
The steeper the graph the __________ it's going
|
The faster it is going
|
|
|
What is happening in downhill section?
|
In downhill sections the object is moving back towards the starting point
|
|
|
What do curves represent?
|
Curves are acceleration or deceleration. Steep curves are acceleration. Shallow are deceleration.
|
|
|
How do you calculate the speed from a distance time graph?
|
speed = gradient = vertical / horizontal
so what is distance travelled / time period |