![]()
![]()
![]()
Use LEFT and RIGHT arrow keys to navigate between flashcards;
Use UP and DOWN arrow keys to flip the card;
H to show hint;
A reads text to speech;
19 Cards in this Set
- Front
- Back
|
Observational study |
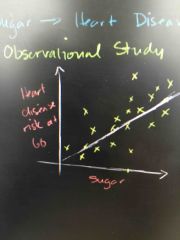
I.e. Correlations |
|
|
Sample study |
Randomly sample source. More sample the better. To estimate. To get a sense of something. |
|
|
Experimental study |
Experimental group, control group. Randomly put in either group. Find causality. |
|
|
Define correlations and causality |
Todo |
|
|
What is the mean sign what is the standard deviation sign |
µ (mu mean sign) σ (sigma standard deviation) |
|
|
Set: X \ Y means? |
X not in Y. X = {1,2} Y = {1,2,3} X \ Y = {} |
|
|
P(A or B) = P(A) + P(B) - ? |
P(A or B) = P(A) + P(B) - P(A and B) |
|
|
Empirical Rule? |
68% - 95% - 99.7% for normal distribution problems |
|
|
how to calculate z-score? define what is a z-score. |
z = (X - population mean) / standard deviation z-score or standard score indicates how many standard deviation an element is from the mean |
|
|
When two events, A and B, are dependent, the probability of both occurring is: P(A and B) = ? |
P(A and B) = P(A) * P(B|A) P(A and B) = P(B) * P(A|B) P(B|A) = P(A and B) / P(A) |
|
|
Data Types |
Discrete Continuous Ordered Ordinal (S,M,L) Fields (temp) (values are Quantitative comparable) (1,2,3) Unordered Nominal (shape) Cyclic values Categories (directions, hues) (nationality) |
|
|
Give some examples of construct and operational definition |
construct: intelligence, hunger, maturity operational definition: grams of food consume, number of questions answered correctly |
|
|
Define the core activities for each of the following analysis: Descriptive Analysis, Inference, Prediction, Design |
Descriptive analysis: EDA, quantification, summarization, clustering Inference: estimation, sampling, variability, defining populations Prediction: machine learning, supervised learning Design: design experiments |
|
|
What is A/B (split) testing? |
Compare two variants A and B in a controlled experiment. For example, showing two variant of a web page to similar visitors at the same time to see which gives a better conversion rate. |
|
|
In data analysis, a descriptive question is... |
one that seeks to summarize a characteristic of a set of data. e.g. proportion of males, mean number of servings of fresh fruits and vegetables per day. There is no interpretation of the result itself as the result is a fact. |
|
|
In data analysis, an exploratory question is... |
one in which you analyze the data to see if there are patterns, trends or relationships between variables. Also called "hypothesis-generating" analyses because rather than testing a hypothesis, you are looking for patterns that would support proposing a hypothesis. e.g. propose the hypothesis that "among adults, eating at least 5 servings a day of fresh fruit and vegetables is associated with fewer viral illnesses per year" |
|
|
In data analysis, an inferential question is... |
a restatement of a proposed hypothesis as a question and would be answered by analysing a different set of data. By analysing this different set of data you are both determining if the association you observed in your exploratory analysis holds in a different sample. |
|
|
In data analysis, a predictive question is... |
one you are less interested in a cause but just to predict a result. For example higher income may be one of the final set of predictors, and you may not know (or even care) why people with higher incomes are more likely to eat diet high in fresh fruits and vegetables, but what is most important is that income is a factor that predicts this behavior. |
|
|
In data analysis, a mechanistic question is... |
a question that asks how a diet high in fresh fruits and vegetables leads to a reduction in the number of viral illnesses would be a mechanistic question |