![]()
![]()
![]()
Use LEFT and RIGHT arrow keys to navigate between flashcards;
Use UP and DOWN arrow keys to flip the card;
H to show hint;
A reads text to speech;
20 Cards in this Set
- Front
- Back
|
Population
|
The larger, comprehensive group being studied
|
|
|
Population
|
The larger, comprehensive group being studied
|
|
|
Sample
|
A subset of the population
|
|
|
Statistic
|
A single measure of some attribute of a sample (e.g. mean)
|
|
|
Parameter
|
A number that describes a population
|
|
|
Sampling Error
|
The difference between the sample and population averages
|
|
|
Constructs
|
Any complex concept that is not described in a concrete measurement
|
|
|
Operational Definition
|
A way of turning Constructs into Variables we can measure; A way of describing a Variable in terms of how we measure it
|
|
|
Variable
|
Any data item that can be measured or counted.
|
|
|
Hypothesis
|
A statement of relationship between two or more variables
|
|
|
Statistical Hypothesis
|
Either (1) a statement about the value of a population parameter (e.g., mean, median, mode, variance, standard deviation, proportion, total), or (2) a statement about the kind of probability distribution that a certain variable obeys
|
|
|
Lurking Variable
|
A variable hat is not included as an explanatory or response variable in the analysis but can affect the interpretation of relationships between variables - it can falsely identify a strong relationship or hide the true relationship.
|
|

|
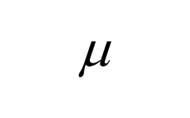
Statistical symbol for population average
|
|

|
Statistical symbol for sample average
|
|
|
Random Sample
|
A subset of a popluation in which each member of the subset has an equal probability of being chosen. A simple random sample is meant to be an unbiased representation of a group.
|
|
|
Convenience Sample
|
One of the main types of non-probability sampling methods made up of people who are easy to reach (e.g. A pollster interviews shoppers at a local mall)
|
|
|
Response Bias
|
A general term for a wide range of cognitive biases that influence the responses of participants away from an accurate or truthful response. These biases are most prevalent in the types of studies and research that involve participant self-report, such as structured interviews or surveys.
|
|
|
Non-response Bias
|
The bias that results when respondents differ in meaningful ways from nonrespondents. Nonresponse is often problem with mail surveys, where the response rate can be very low.
|
|
|
Frequency Table
|
A statistical record of how often each value in a set of data occurs. A frequency table is used to summarize categorical, nominal, and ordinal data.
|
|
|
Relative Frequency
|
The proportion of times the event happens. Relative frequency = Subgroup count / Total count
|

