Reading...
![]()
Play button
![]()
Play button
![]()
Use LEFT and RIGHT arrow keys to navigate between flashcards;
Use UP and DOWN arrow keys to flip the card;
H to show hint;
A reads text to speech;
34 Cards in this Set
- Front
- Back
|
Diagnostic criteria for monoclonal gammopathy of undetermined significance include all of the following EXCEPT:
a. Serum monoclonal spike (<3.5 g/dL if IgG, <2 g/dL if IgA) b. Bone marrow plasmacytosis <10% c. No lytic bone lesions d. No symptoms associated with myeloma e. Increased serum calcium |
e.
|
|
|
Blast morphology of AML-M1 includes all of the following features EXCEPT:
a. Nondescript cytology b. Round to irregular nuclear contours c. Absent nucleoli d. Scant to ample blue cytoplasm e. Rare to occasional Auer rods |
c. The nuclei in AML-M1 have one or more distinct nucleoli.
|
|
|
Features seen in AML-M4E (AMML Eo) include all the following EXCEPT:
a. Abnormal eosinophilic bone marrow precursors b. Abnormalities of chromosome 16 c. Decreased number of bone marrow neutrophils d. False positives are seen with hyperproteinemia. e. In children younger than 6 months old, the test may be negative. d. Usually show peripheral blood eosinophilia e. Positivity for nonspecific esterase staining in monocytic precursors |
d. The peripheral blood findings are usually similar to other cases of AMML. Despite the presence of eosinophils in the bone marrow, only occasional cases display abnormal and increased eosinophils in the peripheral blood.
|
|
|
The AML-M3 microgranular variant may be distinguished from AML-M3 by all of the following EXCEPT:
a. Blast morphology b. Higher WBC count c. Higher circulating numbers of malignant cells d. Down-regulation of HLA-DR e. Relapsed blast morphology after treatment with ATRA |
d.
|
|
|
Nonspecific esterase positivity in AML blasts indicates:
a. Myeloid maturation b. Monocyte differentiation c. Decreased lysozyme in serum d. AML-M4 rather than AML-M5 e. Predominance of promonocytes |
b.
|
|
|
AML-M6 leukemias are characterized by all of the following criteria EXCEPT:
a. The presence of >20% myeloblasts with erythroid predominance b. Relation to therapy in most cases c. The presence of giant erythroid precursors with megaloblastic maturation d. The presence of erythroid precursors with prominent nuclear abnormalities such as binucleation, multinucleation, karyorrhexis, nuclear lobation, and vacuoles e. Another name is “Di-Guglielmo syndrome” |
a. Greater than 30% myeloblasts are necessary to define AML-M6.
|
|
|
Normochromic, normocytic anemia without apparent reticulocytosis is usually seen in all of the following EXCEPT:
a. Anemia of chronic disease b. Renal disease c. Liver disease d. Early iron or B12/folate deficiency e. Symptomatic G6PD deficiency |
e. If the anemia is very mild or in the quiescent stage, the hemolytic anemia may present as a normocytic normochromic anemia with only mild RBC abnormalities.
|
|
|
Spherocytes may be seen in all of the following conditions EXCEPT:
a. Burn injury b. Hereditary elliptocytosis c. Hereditary spherocytosis d. Autoimmune hemolytic anemia e. Sickle cell disease |
e.
The peripheral smear findings in sickle cell disease include anisocytosis, poikilocytosis, reticulocytosis, polychromasia, target cells, sickle cells, “boat-shaped” cells, and red cell fragments. However, because of the high level of hemoglobin F in the first months of life, these findings may not always be present. |
|
|
Methodologies used for hemoglobin identification include all of the following EXCEPT:
a. High-performance liquid chromatography b. Capillary zone electrophoresis c. DNA testing d. Sickle solubility testing e. Hemoglobin gel electrophoresis |
d.
|
|
|
Which of the following is NOT associated with a sickling disorder?
a. Hemoglobin SS b. Hemoglobin SD c. Hemoglobin SG d. Hemoglobin SCHarlem e. Hemoglobin SC |
c. Hemoglobin SG can pose a diagnostic challenge since both an alpha and beta chain variant are seen. In the absence of significant levels of hemoglobin F, this should create four separate peaks or bands on HPLC, isoelectric focusing gel, capillary zone, or hemoglobin gel electrophoresis.
|
|

The following figure (Fig. 16.1) represents a sickling solubility test. All the following are true about the test EXCEPT:
a. The test requires lysis of RBCs. b. The test depends on the solubility of deoxygenated sickle hemoglobin. c. The test detects sickle cell disease only. |
c.The sickle solubility test
detects the presence of a sickling hemoglobin and is positive in HbAS, HbSS, or HBS/b+/0-thalassemia, where the level of hemoglobin S is greater than 10%. It is also positive in the rare sickling variants which have both the hemoglobin S beta globin gene mutation and other mutations such as hemoglobin C Harlem. False positives can occur in any condition which results in increased plasma turbidity such as elevated WBC count, hyperproteinemia or hyperlipidemia. A positive sickling test needs to be confirmed by definitive testing. |
|
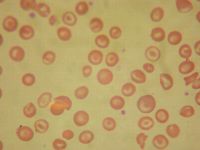
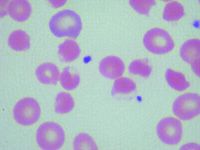
The following peripheral smear (Fig. 16.2) seen in hemoglobin SC below is different from the peripheral smear seen in sickle cell disease in all the following ways EXCEPT that hemoglobin SC:
a. Shows more polychromasia b. Shows more target cells c. Shows irregularly shaped crystals d. Does not usually show Howell-Jolly bodies e. Shows “fat” sickle cells |
a.
|
|
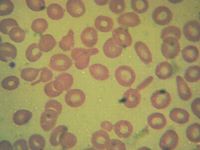
The blood smear (Fig. 16.3) was from a patient with the following hematologic data: RBC Count 5.81 [3.70-4.87] M/uL Hemoglobin 11.5 [10.6-13.5] g/dL Hematocrit 36.3 [32.9-41.2] % MCV 62.5 [77.7-93.7] fL MCH 19.8 [25.3-30.9] pg MCHC 31.7 [31.0-34.1] g/dL RDW 14.7 [12.4-15.1] %
These data best represent: a. Hemoglobin C trait b. Homozygous C disease c. Hemoglobin SC disease d. Beta thalassemia trait e. Homozygous E disease |
d. This is a molecularly confirmed
beta-thalassemia heterozygote. Microcytosis, teardrop cells, and ovalocytes, rare target cells are most consistent with beta thalassemia. |
|
The following figure (Fig. 16.4) best represents:
a. Platelet secretion defect b. Bernard-Soulier disease c. Glanzmann thrombasthenia d. von Willebrand disease e. May-Hegglin anomaly |
c.The table below describes the various platelet aggregation patterns seen in select disorders.
|
|
The following figure (Fig. 16.5) best represents:
a. Glanzmann thrombasthenia b. May-Hegglin anomaly c. Bernard Soulier syndrome d. Gray platelet syndrome e. Hereditary elliptocytosis |
d.
|
|
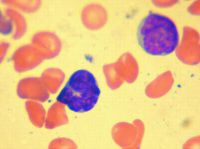
The following figure (Fig. 16.6) from a 32-year-old man with six-day history of coughing, emesis, and lymphocytosis best represents:
a. Non-Hodgkin lymphoma b. Epstein-Barr infection c. Congenital leukemia d. RSV infection e. Bordetella pertussis |
e.
|
|
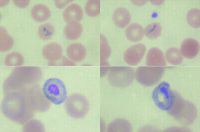
The following figure (Fig. 16.7) best represents:
a. Plasmodium falciparum b. Plasmodium malaria c. Plasmodium vivax d. Plasmodium ovale e. Babesiosis |
b. lack of enlargement of the infected RBCs and lack of Schüffner's stippling. This would eliminate
Plasmodium vivax and Plasmodium ovale. The answer is most likely Plasmodium malaria because Plasmodium falciparum is usually associated with fine ring forms and the characteristic “banana” shaped gametocytes. Babesiosis would have many smaller ring forms infecting single RBCs, some demonstrating a “Maltese cross” formation. |
|
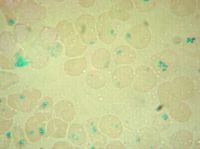
The picture (Fig. 16.8) is an iron stain of RBC inclusions that can be seen in:
a. Functional asplenism b. Iron anemia c. Lead poisoning d. Beta thalassemia major e. Hereditary hemochromatosis |
a. The RBC inclusions are
Pappenheimer bodies, which are iron-staining granules often seen as clumps at the periphery of the RBC. These are seen in sideroblastic and megaloblastic anemias, following splenectomy, alcoholism, and some hemoglobinopathies |
|
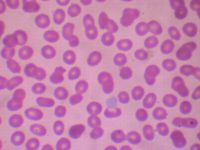
Which RBC abnormality seen with vitamin C overdose in an African American child is represented in the following picture (Fig. 16.10)?
a. Methemoglobinemia b. Thalassemia major c. Hexokinase deficiency d. G6PD deficiency e. Pyruvate kinase deficiency |
d.
The findings in demonstrate the “blister” and “bite” RBCs typically seen in G6PD deficiency, which is often seen in male patients of Mediterranean, Asian, or African descent. It should be noted that this picture is consistent with recent exposure to medications (including high dose vitamin C) that can create an overwhelming oxidative RBC stress. Bite cells, polychromasia, anisocytosis, and poikilocytosis can also be seen in a patient with methemoglobinemia. This can be distinguished from G6PD deficiency by the appearance of brownish appearing blood, because of ingestion of medications that cause methemoglobinemia and cyanosis in the patient. Peripheral blood smear findings in pyruvate kinase deficiency (which is autosomal recessive in inheritance and commonly seen in patients of Northern European descent) include ovalocytes, elliptocytes and poikilocytosis prior to splenectomy and prominent echinocyte formation with a tendency toward macrocytosis after splenectomy. Patients with thalassemia major have marked anisocytosis, marked poikilocytosis, marked polychromasia, increased NRBCs, target cells and tear drop cells (especially beta thalassemia major). Hexokinase deficiency is also often seen in patients of Northern European decent with a peripheral blood picture indistinguishable from pyruvate kinase deficiency. |
|
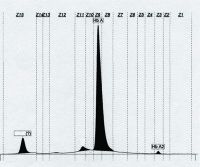
The following capillary zone electrophoresis (Fig. 16.11) demonstrates a very fast moving hemoglobin peak. All the following are true of this hemoglobin EXCEPT:
a. Comprised of four beta globin chains b. Is an unstable hemoglobin c. Is detected early in life d. Carries oxygen e. Can be confirmed by Heinz body prep |
d.
The very fast-moving peak is hemoglobin H (Hb H). Because it is composed of four beta globin chains, it has a very fast migration on alkaline gel electrophoresis, capillary zone electrophoresis, and HPLC. Hb H is the result of the loss of three alpha globin chains and can be detected using an assay such as a Heinz body test that detects unstable hemoglobin. Hb H has a high affinity for oxygen and is not subject to the Bohr effect; therefore, Hb H inadequately supplies oxygen to the tissues under physiologic conditions. Patients with significant levels of Hb H have a defect in oxygen-carrying capacity that is more than expected on the basis of the Hb concentration. |
|
|
In a patient receiving treatment with rituximab, which of the following markers may be altered or lost as result of treatment?
a. CD10 b. CD20 c. CD5 d. Surface light chains e. CD79a |
b.
Rituximab is a chimeric antibody that recognizes the CD20 molecule and is used in the treatment of B-cell non-Hodgkin lymphoma. Anti-CD20 therapy may result in altered expression of CD20 in the tumor cells. Thus, CD20 cannot be used to identify B-cell populations. In this context, B cells can be identified by expression of CD19 and surface immunoglobulin. They may also retain expression of CD10, CD5, and CD23. |
|
|
Macrocytosis can occur in all of the following conditions EXCEPT:
a. Dihydrofolate reductase deficiency b. Lesch-Nyhan syndrome c. Autoimmune hemolytic anemia d. Congenital dyserythropoietic anemia type I e. Deficiency of transcobalamin II |
c.
Other conditions that can be associated with a macrocytic anemia include Diamond Blackfan anemia, liver disease, postsplenectomy, and myelodysplastic syndrome. |
|
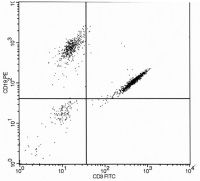
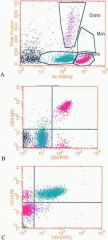
The following flow cytometry histogram (Fig. 16.12) from a peripheral blood two-color analysis of lymphoid cells:
a. Indicates over compensation error with too high a proportion of the PE signal subtracted from the FITC channel b. Is consistent with biphenotypic B and T leukemia c. Indicates undercompensation error with too much spillover of FITC signals into the PE channel d. Indicates overcompensation error with too high a proportion of FITC signal subtracted from the PE channel |
c.
The dual CD3+ and CD19+ events are displayed in a diagonal manner typical of excessive spillover and undercompensation of the FITC emission that spills over into the PE channel (i.e., there is too small a proportion of the FITC signal subtracted from the PE channel). Undercompensation errors often result in overestimating the frequency of dual positive cells. Diagonal clustering indicates that there is a fixed proportional relationship between PE and FITC emissions in the cluster of event that is seldom a natural phenomenon. In this case, the CD3 FITC positive events erroneously appear as if it also bound the CD19 PE antibody. Correct compensation would have removed the proportion of CD3 FITC signal that spillover into the PE channel resulting in this population appearing in the CD3 only right lower quadrant of the histogram. In fact, careful inspection of the histogram reveals a second minor compensation error resulting from excess spillover of CD19 PE signal into the CD3 FITC channel (note the slight diagonal appearance of the CD19 only positive cluster in the upper left quadrant); this error was not of sufficiently magnitude to interfere with accurate enumeration of the B cells in this example. This illustration also reflects the fact that FITC emissions spillover into PE channel detector is proportionally greater than PE spillover into the FITC channel detector. |
|
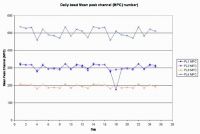
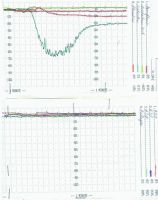
A laboratory records the daily mean peak fluorescent channel numbers (MPC) for a standardized fluorescent bead as a means of tracking instrument performance over time. The following chart (Fig. 16.13) depicts the results of this monitor for 1 month. Possible explanations for the observed results on day 18 include:
a. Laser misalignment or degradation of laser output b. Photomultiplier tube or optical filter problem c. Deterioration of the beads d. Partial obstruction from a clog in the flow cell |
b.
Day 18 shows a degradation of the signal detected by only one of the four detectors (FL-1) and hence does not reflect global excitation or emission problems that might arise from a misaligned or failing laser or from a clog in the flow cell that disrupts the sample streamlaser alignment. These types of problems would result in signal degradation in all four channels and not just one. Degraded beads or bead prepared in an improper manner may result in suboptimal excitation and emission characteristics and also would be the expected result in a drop in MPC in all four detectors, not just one. The low bead intensity in FL-1 on day 18 points to either a problem with the optic filters that are placed within the FL-1 collection pathway to block out secondary carryover signals coming from fluorochromes, or may be due to a problem with performance of the FL-1 PMT detector. In this particular case, someone forgot to remove a filter that was placed in front to the FL-1 PMT the evening before that used a special protocol and different fluorochrome. |
|
|
All of the following are hematologic causes of hydrops fetalis associated with increased red cell production EXCEPT:
a. Pyruvate kinase deficiency b. οβ thalassemia trait c. Immune hemolysis: Rh and Kell d. Rare unstable α-chain variants e. G6PD deficiency |
b.
Of all the above possibilities it would be very unusual for ο β thalassemia trait to cause the degree of anemia that would result in hydrops fetalis since the predominant hemoglobin during pregnancy and at the time of birth is hemoglobin F, which is composed of a tetramer of two alpha and two gamma chains. The amount of these globin chains would be near normal levels in οβ thalassemia trait. Hematologic causes of hydrops fetalis due to impaired red cell production include parvovirus B19 infection, Diamond-Blackfan anemia, congenital dyserythropoietic anemias, and α thalassemia major. These conditions markedly decrease red cell production to the point that high output cardiac failure with generalized edema and extramedullary hematopoiesis result. |
|
|
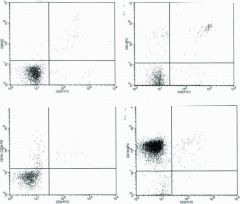
A 2-month-old male infant came for evaluation of cough and failure to thrive and was found to have a lymphocyte count of 1400/µL. Differential diagnostic considerations based on the depicted flow cytometry lymphocyte gated results (Fig. 16.14) include all the conditions EXCEPT:
a. DiGeorge syndrome b. Severe combined immunodeficiency syndrome c. Bruton agammaglobulinemia d. CD3 delta-chain deficiency |
c.
One should be aware that a lymphocyte count below 3000/µL are abnormally low in newborns and infants and, if persistent, should lead to investigation of underlying immunodeficiency. Typically there are more T cells than B cells in the peripheral blood of infants just as in adults, albeit with a slightly high proportion of B cells; this is just the opposite of what is depicted in the illustrations. Therefore, there is severe depletion of both T helper (CD3+ / CD4+) and T suppressor (CD3+ / CD8+) rather than an increased number of B cells. Even though B cells comprised over 90% of cells in the sample, the absolute number of B cells is actually in the normal range for infants. T lymphopenia may be seen in a number of conditions including malnutrition and chronic steroid treatment. T lymphopenia is also characteristic of severe combined immunodeficiency syndrome (SCIDS) and patients with the complete form of DiGeorge syndrome (i.e., thymic and parathyroid hypoplasia/aplasia with immunodeficiency, hypocalcemia and congenital heart disease). In contrast, Bruton agammaglobulinemia is associated with a decreased number of peripheral blood B cells and normal number of T cells. CD3 delta chain deficiency is one of the molecular causes of the SCIDS; this could have been surmised in view of the manner of typing T cells in this case (i.e., use of anti-CD3 antibodies). This patient actually presented with Pneumocystis jiroveci pneumonia and was subsequently found to have a variant of SCIDS due to a genetic mutation leading to deficiency of the |
|
The following three histograms (Fig. 16.15) were acquired from a bone marrow sample of a 3-year-old boy with enlarged lymph nodes and elevated WBC with blasts in the peripheral blood. True statements regarding the histograms include:
a. The child has CD4-positive T-cell leukemia consistent with T precursor lymphoblastic leukemia. b. The child has an increased number of immature B cells consistent with B-precursor lymphoblastic leukemia. c. The findings are characteristic of Bordetella pertussis infection. d. The histograms depict an unusual case of biclonal T- and B-cell lymphoblastic leukemia. |
b.
The findings are characteristic of phenotype of common childhood ALL with increased number of cells in the blast window of the CD45/SS histogram (i.e., weak CD45 expression and low side scatter depicted in blue) that co-express CD19 and CD10 (right histogram). It is fairly common to have some peripheral blood contamination that accounts for the increased number of mature CD4 positive T cells in marrow samples that are bright CD45 positive (depicted in red in middle histogram, upper right quadrant); this should not be construed as indicating biclonal disease. While B. pertussis infection is associated with a marked peripheral blood B cell lymphocytosis, the B cells are mature with bright CD45 and absent CD10. |
|
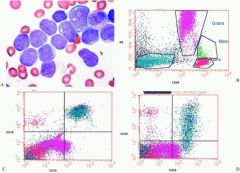
An extensive panel of B and T lymphocyte and myeloid markers for the acute leukemia depicted below (Fig. 16.16) showed the blasts to express only CD19, CD10, Tdt, CD33, and CD13 (blue cell clusters). The leukemia is best classified as:
a. Bilineal B precursor and acute myeloid leukemia b. Biphenotypic acute leukemia c. Precursor acute lymphoblastic leukemia d. Acute myeloid leukemia e. Acute ambiguous undifferentiated leukemia |
c.
This case highlights several important points including: (a) the need for integrating blast morphology with immunophenotyping results; (b) CD markers are not entirely lineage specific; and (c) there is often limited aberrant lineage marker expression in many cases of acute leukemia that should not be construed as indicating true biphenotypic acute leukemia. CD markers vary in their relative strength for assigning lineage. This led to the development of a grading system that recognizes some markers, such as intracellular myeloperoxidase (myeloid); cCD3 (T lymphocytic); and cCD22, cIgM, and surface CD79a (B lymphocytic) which are highly predictive of lineage. These makers are each assigned a score of 2.0 in a system that requires a minimal cumulative expression score of 2.5 or higher for conclusively assigning that lineage to the leukemia. Other B lymphocyte markers (e.g., CD19, CD10, CD20); T lymphocyte markers (e.g., CD2, CD5, CD8); and myeloid markers (e.g., CD117, CD13, CD33, and CD65) are less specific, and each assigned values of 1.0. Tdt (lymphoid); CD24 (B lymphocyte); CD7 and CD1a (T lymphocytic); CD14, CD15, CD64 (myeloid) markers have more limited specificity and each assigned scores of 0.5 in the scoring system. The morphology of the illustrated leukemia shows mainly L1 type lymphoblasts . The presence of CD19, CD10, and Tdt (cumulative score 2.5) and blast morphology are sufficient for assigning B precursor status to this case. Approximately 20% of B precursor ALL cases aberrantly coexpress myeloid markers such as CD33 and CD15 that together are not sufficient for meeting criteria for biphenotypic leukemia. Bilineal leukemia has two different cell lines, each of different lineage. Though the histograms are not displayed in a manner that shows coexpression of the myeloid markers CD15 and CD33 on the same cells as CD19 and CD10, it is clear that all the blasts express all four markers. |
|
|
Characteristics of Diamond Blackfan anemia include all of the following EXCEPT:
a. Normocytic or macrocytic anemia b. Reticulocytopenia c. 25% of patients with mutations in ribosomal protein S19 d. Elevated RBC adenosine deaminase activity e. IVIG is the mainstay of treatment. |
e.
Diamond Blackfan anemia is a congenital bone marrow failure syndrome characterized by a normocytic, though often macrocytic, anemia associated with reticulocytopenia with thrombocytopenia and leukopenia often seen. Physical abnormalities are seen in approximately 24% of patients and largely involve the head and face. Approximately 25% percent of patients are noted to have a mutation in the DBA1 gene encoding ribosomal protein S19, and many patients are characterized by an elevated RBC adenosine deaminase activity. Treatment largely involves RBC transfusions and steroids, rarely bone marrow transplantation. Of concern is an increased risk of solid tumor and hematologic malignancies in those patients who reach adulthood. |
|
|
Characteristics of dyskeratosis congenita include all of the following EXCEPT:
a. Ectodermal abnormalities b. Bone marrow failure c. Cancer predisposition d. Extreme telomere shortening e. Autosomal dominance inheritance |
e. Dyskeratosis congenita
(DKC) is a rare form of ectodermal dysplasia and is characterized by dermatologic manifestations and nail dystrophies beginning in the first decade of life and leukoplakia in the second decade of life. Aplastic anemia occurs in one half of patients usually in the second decade of life with cancer developing in 10% by the third and fourth decades. From a hematologic view, thrombocytopenia or anemia is often first seen, followed by pancytopenia. Macrocytosis and elevation of hemoglobin F levels are commonly seen. Inheritance is primarily X-linked,although autosomal recessive and rarely autosomal dominant cases have been reported. Patients with DKC have reduced telomerase activity and abnormally short tracts of telomeric DNA compared with normal controls. |
|
|
Characteristics of congenital amegakaryocytic thrombocytopenia include all of the following EXCEPT:
a. Autosomal recessive inheritance b. Development of aplastic anemia in a high percentage of patients c. Mutations in the c-mpl gene d. Elevated thrombopoietin levels e. With time elevated MCV and hemoglobin F levels are seen |
e. Congenital amegakaryocytic thrombocytopenia
is a rare bone marrow failure syndrome expressed in infancy that is characterized by profound thrombocytopenia and megakaryocytopenia without physical abnormalities. Mutations in the c-mpl gene that result in incomplete formation of the thrombopoietin receptor are felt to be the molecular basis for the disease. Elevated thrombopoietin levels, although not specific to this disease, are typically elevated. Aplastic anemia may eventually develop in these patients. Bone marrow transplantation is the only cure for the disease, and patients require platelet transfusions for survival. |
|
|
With respect to mature B-cell malignancies, which of the following statements are true?
a. CLL cells characteristically express dim CD20, CD5, and CD10. b. Mantle cell lymphoma cells characteristically express bright CD20, CD5, and CD10. c. Follicular lymphoma cells characteristically express CD20 and CD10 but lack CD5. d. ALL the above are correct. e. Only a and b are correct. |
c. CLL cells characteristically express dim CD20 and CD5 but are negative for CD10. Similarly, mantle cell lymphoma cells express bright CD20 and CD5 but are also negative for CD10. Follicular center cell lymphomas characteristically express CD10 and CD20 but lack CD5.
|
|
|
Lymphoproliferative disorders that are sometimes or always associated with Epstein-Barr virus (EBV) include all of the following EXCEPT:
a. Extranodal NK/T-cell lymphoma, nasal type b. Lymphomatoid granulomatosis c. Anaplastic large cell lymphoma d. Burkitt lymphoma e. Angioimmunoblastic T-cell lymphoma |
c.
Detection of EBV can be accomplished by immunohistochemical staining (latent membrane protein-1, LMP-1) or in situ hybridization (EBER). |