![]()
![]()
![]()
Use LEFT and RIGHT arrow keys to navigate between flashcards;
Use UP and DOWN arrow keys to flip the card;
H to show hint;
A reads text to speech;
17 Cards in this Set
- Front
- Back
|
Suppose you were to collect data for each pair of valuables. You want to make a scatter plot. Which variable would best be suited as the explanatory variable and which as the response value? Why? What would you expect to see in the Scatterplot? Discuss the likely direction, form, and strength for Part A through B below. |
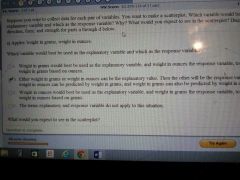
Either weight in grams or weight in ounces can be extraordinary value. |
|
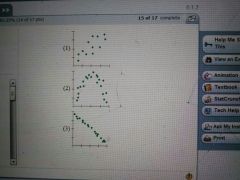
Which of the scatter plots above shows a) no association? b) a negative association? c) a linear association? d) a weak or moderately strong association? e) a very strong association? |
a) none of these scatterplots b) 3 c) scatter plots 1 & 3 d) 1 e) scatter plots 2 & 3 |
|
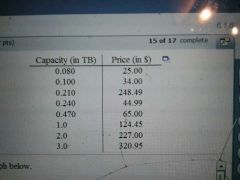
Data drives have been getting larger. Their capacity is now often given in Terabytes (TB) where 1tb equals 1000 gigabytes, or about a trillion bytes. A survey of prices for external disk drive found The data shown above. Complete part a through e |
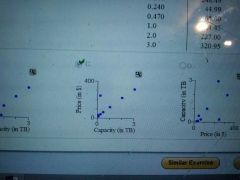
a) choose the right graph. c b) what can you say about the direction of the association? Positive c) what can you say about the form of the relationship? It is linear d) what can you say about the strength of the relationship? It is relatively strong e) does the scatter box shows in the outliers? Yes, the 0.210 TB seems to be overpriced |
|
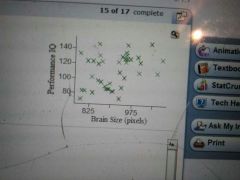
Choose the correct answer |
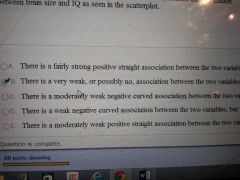
There is a very weak, or possibly no, association between the two variables. |
|
|
A larger farm is considering acquiring a small bookstore. An analyst for the firm, noting that there is a strong, positive relationship between the number of sales people working and the amount of sales, suggest that when there are acquire the store they should hire more people because that will drive your sales. Is his conclusion justified? What alternative explanation can you offer? Use appropriate statistics terminology. |

Not justified, does not demonstrate, not justifiable, however it may be the reverse, that more people were hired as sales increased. |
|
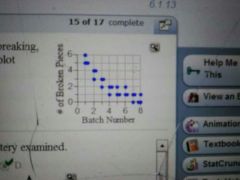
A ceramic factory campfire 8 large batches of pottery each day. In order to better understand pieces breaking, the factory record the number of broken pieces in each batch for 3 days and then creates scatterplots shown in the graph |
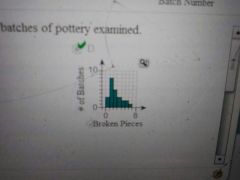
a) make a histogram showing B distribution of the number of broken pieces in the 24 hour batch of pottery examined. The graph b) describe the distribution as shown in the histogram. The distribution is Unimodal and screwed to the right. c) what aspect of the company's problem is more apparently in the scatter plot? The negative, somewhat linear relationship between batch number and broken pieces. |
|
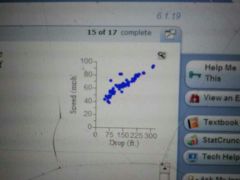
Most roller coasters get passed me by dropping down XV internal inclined. So it makes sense that the height of the drop might be related to the speed of the coaster. Here's a scatter plot of touch me in large drop or 75 roller coasters around the world complete part a & b |
a) does the scatter plot indicate that it is appropriate to calculate the correlation? Explain: yes, it shows a linear form with no outliers. b) in fact, the correlation of speed and drop it 0.91. Describe the association. Choose the correct answer. There is a strong positive, linear association between drop and speed the greater of the coastal initial drop the higher the top speed. |
|

Construct a scatter plot for the data |
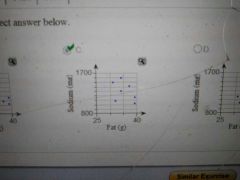
r = -0.431 There is no apparent association between the fat and sodium contents in several brands of fast food burger |
|

|
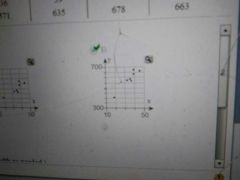
What is the correlation coefficient for the data? 0.954 The scatter plot and high correlation coefficient suggests a strong positive linear relation. |
|
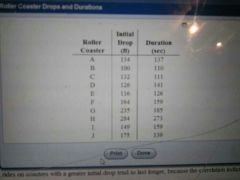
r = 0.928 What do these data indicate about the height of the initial drop of the roller coaster and the duration of the ride |
Generally, rise on coastal with a greater initial drop tends to last longer, because the correlation indicate a strong association. |
|
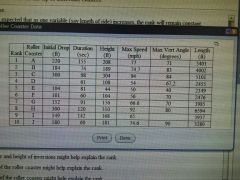
a) It would be expected that as one variable (say length of ride) increases, the rank will improve, which means it will decrease. b) Initial drop has the strongest negative correlation, but even that correlation is only moderate. c) The number and height of inversion might help explain the rank. |
a) explain why in looking for a variable that explains rank, there might be a negative correlation. b) Do any of the provided variables provide a strong predictor for roller coaster rank? c) What other (unaccounted for) variables might help explain the rank? |
|
|
In a Scatterplot, we try to describe the direction of an association. A positive direction is one that can be described how? |
Generally runs from the lower left to the upper right. |
|
|
Which of the following best describes a response variable? |
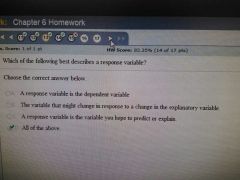
All of the above |
|
|
Which of the following best describes the explanatory variable? |
The explanatory variable explains or predicts changes in the response variable. |
|
|
What is the correlation? |
It measures the strength and direction of linear relationships |
|
|
Which of the following is TRUE about the correlation coefficient? |
We should only find correlation between two variables if they are quantitative, the association is straight enough, and there are no outliers. |
|
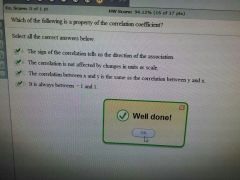
Which of the following is a property of the correlation coefficient? |
All |