![]()
![]()
![]()
Use LEFT and RIGHT arrow keys to navigate between flashcards;
Use UP and DOWN arrow keys to flip the card;
H to show hint;
A reads text to speech;
33 Cards in this Set
- Front
- Back
|
Measuring Mass |
Gram |
|
|
Measuring Volume |
Liter |
|
|
Density Equation |
Density = Mass/Volume |
|
|
Meniscus |
This is the upward or downward curve at the surface of a liquid in a container. Concave Meniscus: curves in because the molecules being more attracted to the wall of the container than each other --- read at bottom Convex Meniscus: curves upward because the molecules are more attracted to each other than the wall of the container -- read at top |
|
|
Dimensional Analysis Factor-Labor Analysis How many cm's are in 2.3 miles? |
2.3 mile * 5,28ft/1 mile * 12in/1ft * 2.54cm/ 1in = 370,000cm |
|
|
Qualitative |
Meaning that it is based on an observation, but it's not directly measured and recorded numerically |
|
|
Quantitative |
Meaning that it is based on a measurement, and it's reported numerically |
|
|
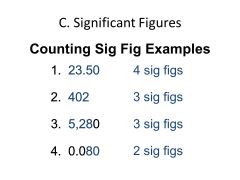
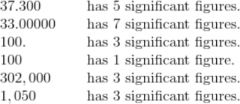
Significant Figure |
Is a number that plays a role in the precision of a measurement. |
|
|
Calculations and Significant Figures Multiplying 40 X 9.2 |
When multiplying and dividing, your answer must have the same number of significant figures as the number with the least number of significant figures. For example, if you are multiplying 40 (with one significant figure) and 9.2 (with two significant figures), your answer should contain only one significant figure, so it should be reported as 400 instead of the 368 your calculator would give you. |
|
|
Metric System |
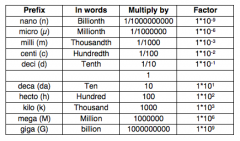
|
|
|
SI Units |
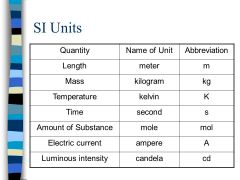
|
|
|
Measures of Central Tendency |
A set of descriptive measures that indicate the typical score. When conducting research, we need or want to know what is most likely going to happen. |
|
|
Mean |
As the data's average score of the sample When other statistical tests fail and you can't use them, you rely on the mean because it has 50% of the scores above it and 50% of the scores below it. It's just the one that's most likely to happen. |
|
|
Median |
The middle score after the scores have been arranged in numerical order Medians are useful for understanding what the central part of the data looks like. If there are a lot of lows and highs, then this score will be least affected by it because all you do is count to the central most number where the scores are in numerical order. If there are two central numbers, you simply average the two. |
|
|
Mode |
The most often occurring value Mode likely has the weakest link to population due to its sampling bias. It can be reported to give the reader of your research an understanding of what the average score looked like. This may be important if your mode was different than the average. If your mode was four cats and your average was one cat, that means something very strange is happening. |
|
|
Variance |
Is the average of each distance from the mean squared |
|
|
Standard Deviation |
The measure of how closely all of the data in the data set surrounds the mean |
|
|
How to Calculate the Standard Deviation? |
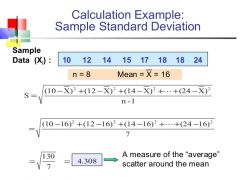
|
|
|
How to find the Range for two Standard Deviations |
You take the mean and +/- the Standard Deviation |
|
|
Human Error |
Includes any basic human mistake: spilling a substance, dropping equipment, forgetting to turn off the drying oven, etc. These errors can and will happen, no matter how avoidable they may seem in hindsight! |
|
|
Random Error |
Which is error that occurs randomly in space and time. This type of error occurs periodically and in no specific pattern and, therefore, gives you imprecise results. Random errors are unavoidable and are just part of every dataset, but they are just as likely to occur in a positive or negative direction. This means that theoretically, after you take enough measurements, the random errors would essentially cancel themselves out, getting you closer to your 'true' value |
|
|
Systematic Error |
Which is error associated with the instruments Perhaps your pipette is not dispensing the correct amount of fluid, or your scales are not calibrated correctly |
|
|
Drift |
This is when an instrument gradually changes over time. Drift often occurs in instruments that record continuously, like detectors |
|
|
Accuracy and Precision |
Accuracy refers to how close a measurement is to the 'true' value Precision, often called reproducibility or repeatability, is the agreement of repeated measurements |
|
|
Descriptive Statistics |
It describes the existing data, using measures such as average, sum and others When you say you are going out for dinner on average twice per week, you're using descriptive statistics. |
|
|
Inferential Statistics |
Tries to infer something about the data. In other words, you are trying to find patterns and relationships in the data. |
|
|
Predictive Statistics |
Tries to predict future conditions based on existing data. |
|
|
Bar Gragh |
A graph with bars of varying heights, is a good visual way to represent the categorical data from a survey for analysis The thing about categorical data is that because they are groups, there is not much to say about other groups that aren't listed on the graph. If you don't have data for other groups, there is not much you can predict about them |
|
|
Scatter Plot |
Is a visual representation of the relationship between two variables Best way to represent quantitative data is with a scatter plot -- can be used to make predictions (linear relationship) |
|
|
Correlation Relationship |
A numerical representation of the strength and direction of the relationship If there is a close relationship, meaning that as one moves, so does the other, then the coefficient is closer to 1 or -1. Remember that if the coefficient is negative, all this means is that when one variable increases, the other variable decreases. A coefficient closer to 0 means that there is less or no relationship between the variables. |
|
|
Internal Validity |
Is the extent to which a researcher can say that only the independent variable affected the dependent variable Low external validity Few extraneous variables |
|
|
External Validity |
The extent to which a study reflects the real world -- not done in a lab (most likely) Low internal validity Lots of extraneous variables |
|
|
|