Reading...
![]()
Play button
![]()
Play button
![]()
Use LEFT and RIGHT arrow keys to navigate between flashcards;
Use UP and DOWN arrow keys to flip the card;
H to show hint;
A reads text to speech;
41 Cards in this Set
- Front
- Back
|
Comparing and Contrasting
|
Used to sort out similarities and differences
Makes data neat and organized Make table and fill in information |
|
|
Concept Map
|
Used to organize information on broad
(general) topics You make a concept map by placing words into ovals and connecting them with linking words (and lines) All ovals need to connect with linking words If you read from the top oval down to t |
|
|
Communication
|
Sharing ideas and info with other
people Involves the skills of reading, writing, speaking, listening, and making models Used to share results, info, and opinions |
|
|
Cross-Linkage
|
A CROSS-LINKAGE connects two different
branches of the map. |
|
|
Cycle Diagrams
|
Shows a sequence of events that is
continuous. It has to show a cycle that does not end. |
|
|
Venn Diagram
|
2 circles that overlap
used to show similarities and differences must put titles at the top of each circle |
|
|
Flow Charts
|
Used to tell the order of events
Each step is connected by an arrow. |
|
|
Observing
|
Using your senses
Scientists use tools to make detailed observations (microscopes) Observations must be factual |
|
|
Quantitative Observations
|
Deal with a number or
amount • Example: There are 14 black chairs in the science room. |
|
|
Qualitative Observations
|
Deals with description
that can not be expressed in numbers • Example: The safety goggle cabinet is white and made of metal. |
|
|
Why is observing important?
|
Keep records of
all observations (drawings) Your records become DATA or EVIDENCE. |
|
|
What is inferring?
|
Explain or interpret
an observation To make an inference …combine data with experience. |
|
|
Why do people infer?
|
Purpose is to reach a logical
conclusion. |
|
|
T/F Is an inference a fact?
|
Inference is NOT a fact, it is
only ONE of MANY explanations for an observation. |
|
|
T/F An inference ALWAYS correct?
|
False; it is not always correct
|
|
|
Predicting
|
Making an inference about a future event based on current evidence or past experience. May be proven FALSE
|
|
|
Classify
|
Grouping together items that are in some way alike.
Used to organize information and objects. Example: Librarians classify books Example: Students are classified by grade level |
|
|
Making Models
|
A model is a picture, diagram, computer image, or other representation of a complex object or process.
Help people understand something that is complex or can’t be seen directly. Ex: globe, model cars, movie sets, etc |
|
|
Scientific Attitudes
|
Science: way of learning about the
natural world. Important to be curious, honest, open minded, skeptical (having doubt), and creative. |
|
|
What are the Steps of the Scientific Method?
|
Purpose, Research, Hypothesis, Experiment, Analysis, Conclusion, Repeat/Communicating
|
|
|
Hypothesis
|
A possible explanation for a set
of observations or answer to a scientific question. |
|
|
T/F A hypothesis is NOT a fact?
|
True; It is not a fact
|
|
|
What must you be able to do with a hypothesis?
|
A hypothesis MUST be testable.
• Researchers must be able to carry out investigations and gather evidence that will EITHER support or disprove the hypothesis. |
|
|
Variables
|
factors being tested that can be changed or manipulated in an experiment.
|
|
|
Controlled Experiment
|
You can only TEST ONE variable at a time (all other variables besides the one being tested MUST be kept
the same) |
|
|
Manipulated Variable
|
(Independent
variable) - The variable that is changed on purpose in order to test hypothesis. |
|
|
Depending Variable
|
(Responding Variable)What changes or what you are measuring in RESPONSE tothe manipulated variable.
|
|
|
What is Data?
|
Data are the facts, figures, and
evidence gathered in experiment |
|
|
How should you record data?
|
Create a data table.
|
|
|
What do graphs show?
|
They show patterns in data.
|
|
|
Control
|
The item you are controlling in the experiment.
|
|
|
Linking Words
|
Connect all ovals
|
|
|
Making Generalizations
|
Assuming that because one thing is like that everything is like that.
EX; I had a hair in my food. There must be hair in all the food. |
|
|
Relating Cause and Effect
|
Because something happens(cause) it makes something else happen (effect)
|
|
|
Theory
|
A belief based on data that something is true.
|
|
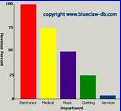
What is this?
|
Bar Graph
|
|
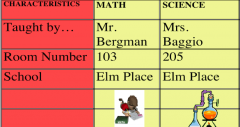
What is this?
|
Compare and Contrast Table
|
|
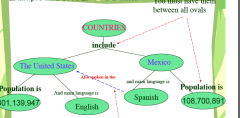
What is this?
|
Concept Map
|
|
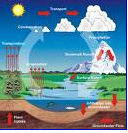
What is this?
|
Cycle Diagram
|
|
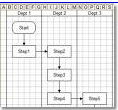
What is this?
|
Flow Chart
|
|
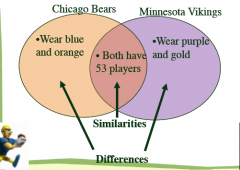
What is this?
|
Venn Diagram
|