Reading...
![]()
Play button
![]()
Play button
![]()
Use LEFT and RIGHT arrow keys to navigate between flashcards;
Use UP and DOWN arrow keys to flip the card;
H to show hint;
A reads text to speech;
31 Cards in this Set
- Front
- Back
|
What is utility?
|
Measurement of satisfaction
Utility = U(Q1,Q2...QN) Q=/>0 As quantity increases, utility increases.\ Users want to maximize utility per given amount of income. Utility is an ordinal measurement; only the order makes sense, not the intervals. Meaning, you want utility to be higher on an indifference curve, but we're not sure by how much. |
|
|
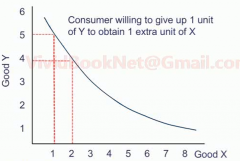
What is an indifference curve?
|
The indifference curve measures how much a consumer prefers 1 good over another in terms of UTILITY, meaning how much more satisfaction he gets from one product in comparison to the other one.
The slope of an indifference curve is the marginal rate of substitution. This means at a given point, a consumer is willing to give up x product for so many of y products. Also are measured on an ordinal scale. Indifference curves may not cross. |
|
|
Draw an indifference curve.
|
|
|
|
Marginal Rate of Substitution
|
How much of x product is worth y product to a consumer. 1x=1y is a plausible solution.
|
|
|
What are Budget Constraints?
|
All the combinations of goods a consumer can buy with given amount of income.
Always assume you are going to consume all of the income. |
|
|
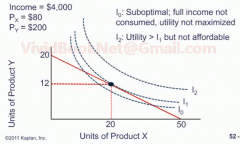
What is the Consumer Equilibrium?
|
Combining the budget constraint chart with the indifference curve will result in the Consumer Equilibrium chart whereby it shows at what ratio the consumer is going to buy two different products in order to maximize his utility AND spend all of his income.
The consumer equilibrium is at the tangent intersection of the two lines. |
|
|
Draw an consumer equilibrium chart with 3 indifference curves.
|
|
|
|
What is the substitution effect?
How does it work? |
As a price of a good falls, a consumer will buy more of it.
The utility/per $ spent is increasing and that is why the consumer will buy more of it. |
|
|
What is the income effect?
|
The effect an income has on what products are purchased.
|
|
|
Normal goods?
|
Normal good is a good which affected by the income effect whereby it is purchased more as the income increases.
|
|
|
Inferior goods?
|
The opposite of a normal good. The more income, the less demand for this good. Think Ramen noodles
|
|
|
Giffen good?
|
Negative income effect > positive substitution effect.
This means as price falls the product losses demand, as price rises the demand increases. Think LV bag. |
|
|
Account profit?
|
Rev - Explicit costs
|
|
|
Economic Profit?
|
Accounting profit - implicit costs.
Implicit costs are opportunity costs and the return of owners capital. Normal profit = (economic profit = 0), meaning you still have an accounting profit. Economic profit always mean the accounting profit are positive. |
|
|
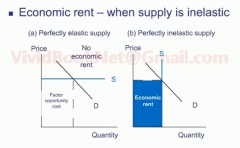
Economic rent?
|
The degree of fluctuation between income received for different individual tasks conducted by one individual or business.
For example, a highly trained individual whom only specializes in one task will get upwards of 200k a year whereby if he worked on any other project his skills would be inapplicable and as a result would not be highly compensated. This is an example of high economic rent. Therefore, perfectly elastic supply would result in low economic rent as there are many alternatives, while perfectly inelastic supply results in no high economic rent. |
|
|
Draw economic rent in perfectly elastic and inelastic supply scenarios.
|
|
|
|
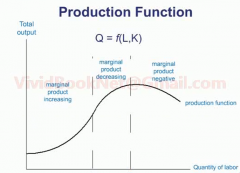
Draw a Production function.
|
|
|
|
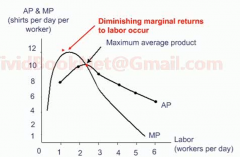
Explain marginal production and its stages.
|
As more workers are employed, more products are produced. As even more workers are employed the production quantity begins to DIMINISH until it finally begins to result in marginal product negative.
|
|
|
Total Cost formula =
|
Total Variable Cost (TVC) + Total Fixed Cost (TFC).
Variable costs: costs per unit produced. Fixed costs: costs that will incurred regardless of unit produced. |
|
|
AFC?
|
Total fixed costs / quantity produced.
As quantity increases, AFC decreases. |
|
|
AVC
|
Total variable costs / quantity produced.
|
|
|
ATC, AFC, AVC, MC chart.
Where does the Marginal Cost line cross the ATC and AVC? Why does it cross there? |
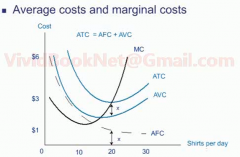
If the marginal cost of producing a unit is less than the AVC and ATC then it brings both of those variables down, but once MC is more expensive than AVC and ATC it starts to bring AVC and ATC values up.
That is why MC crosses AVC & ATC at the their bottoms. |
|
|
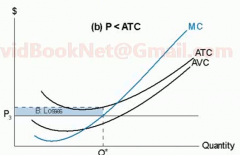
Breakeven in the short and long run.
|
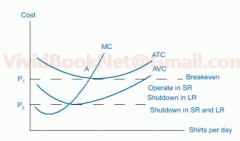
In the short run if the costs are too high it is possible to shut down production resulting in no variable costs, although FC will persist. In the long run its not feasible.
If the price falls bellow average variable costs than the firm will shut down both in the LR and SR. If the price is above ATC than the company is profitable. |
|
|
Economies and Dis-economies of scale
|
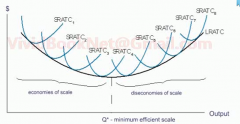
Similar to marginal products produced.
|
|
|
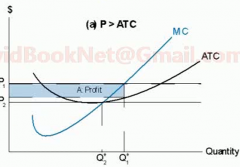
Breakeven and Profit maximization
|
|
|
|
Profit maximization - Perfect competition.
|
|
|
|
Profit maximization - Imperfect competition
|

|
|
|
Profit maximization in the long run
|
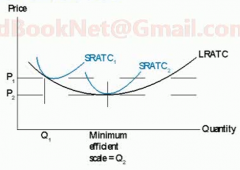
Under perfect competition the price will fall to its minimum as firms move to minimum efficiency scale.
|
|
|
What is the Marginal and Average product relationship?
|
They intersect at the average product.
|
|
|
Draw the cost and productive curves and how they relate to AP, MP, MC, & AVC.
|
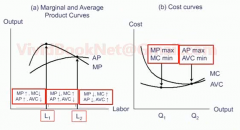
As diminishing returns become apparent the average product decreases and marginal costs begin to rise.
|
|
|
Explain the importance of Marginal Revenue Product.
|

As long as Marginal revenue product is greater than the increased costs then the total profit is maximized with the increase of the marginal product.
Therefore, MRP = Cost MRP = Wage Example: Mpa = capital Mpb = labour If MPa/Pa > MPb/Pb then use more Mpa/Pa to decrease costs. |