Reading...
![]()
Play button
![]()
Play button
![]()
Use LEFT and RIGHT arrow keys to navigate between flashcards;
Use UP and DOWN arrow keys to flip the card;
H to show hint;
A reads text to speech;
38 Cards in this Set
- Front
- Back
|
Central tendency
|
a single value used to describe the center point of a data set
|
|
|
Measures of central tendency
|
mean, median, and mode
|
|
|
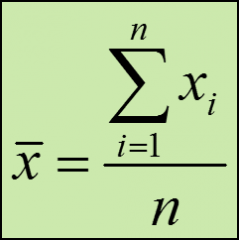
Mean
|
AKA average, is the most common measure of central tendency;
add all values in a data set and divide the result by the number of observations |
|
|
x- bar = sample mean
xi = the values in the sample n = the number of data values in the sample |
|
|
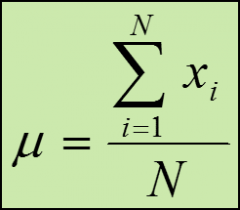
Mu - the population mean
N - the number of data values in the population |
|
|
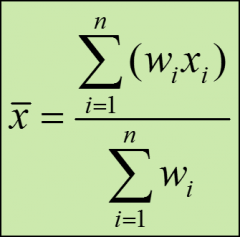
Weighted mean
|
allows you to assign more weight to certain values and less weight to others
|
|
|
wi - the weight for each data value xi
bottom of formula - the sum of all the weights |
|
|
Advantages of using mean to summarize data
|
simple to calculate
summarizes the data with a single value |
|
|
disadvantages of using the mean to summarize data
|
with only a summary value you lose information about the original data;
the value of the mean is sensitive to outliers |
|
|
median
|
the value in the data set for which half the observations are lower and half are higher;
NOT sensitive to outliers |
|
|
formula for the index point for the median
|
i = .5(n)
whenever the index point isn't a whole number, round the value up to the next highest whole number |
|
|
mode
|
value that appears most often in a data set;
if no data value or category repeats, we say the mode doesn't exist; more than one mode can exist if 2 or more values tie for most frequent; particularly useful way to describe categorical data |
|
|
Which measure of central tendency should you use?
|
mean is generally used, unless extreme outliers exist;
if outliers are present, the median is often used, since the median isn't sensitive to outliers; for categorical data, the mode is the best choice |
|
|
Measures of variability
|
show how much spread is present in the data;
range, variance, and standard deviation |
|
|
range
|
simplest measure of variation;
difference between the highest value and the lowest value in a data set |
|
|
s^2 =
|
sample variance
|
|
|
Sample variance formula
|
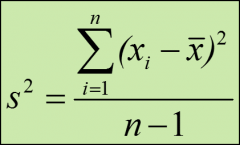
(xi - xbar) = the difference between each data value and the sample mean
|
|
|
Standard deviation
|
the square root of the variance;
has the same units at the original data |
|
|
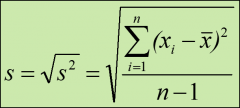
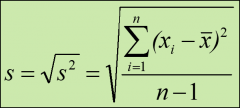
Sample standard deviation formula
|
|
|
|
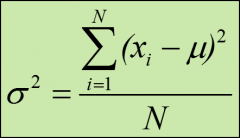
Population variance formula
|
|
|
|
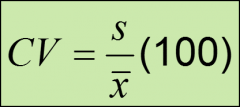
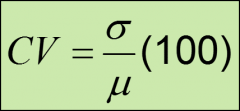
coefficient of variation (CV)
|
measures the standard deviation in terms of its percentage of the mean;
a high cv indicates high variability relative to the size of the mean and vice-versa; a smaller coefficient of variation indicates more consistency within a set of data values |
|
|
sample coefficient of variation formula
|
|
|
|
population coefficient of variation formula
|
|
|
|
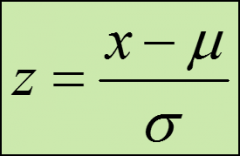
z-score
|
identifies the number of standard deviations a particular value is from the mean of its distribution;
has no units; 0 for values equal to the mean; positive for values above the mean; negative for values below the mean; |
|
|
z-score of an outlier
|
is above +3 or below -3
|
|
|
population z-score formula
|
|
|
|
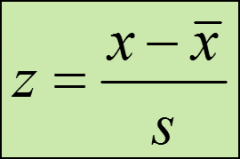
sample z-score formula
|
|
|
|
The empirical rule
|
if a distribution follows a bell-shaped, symmetrical curve centered around the mean, we would expect:
approx 68% of the values to fall within +/- 1 standard deviations from the mean; approx 95% of the values to fall within +/- 2 standard deviations from the mean approx 99.7% of the values to fall within +/- 3 standard deviations from the mean |
|
|
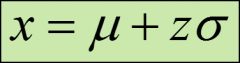
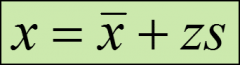
population z-score in terms of x formula
|
|
|
|
sample z-score in terms of x formula
|
|
|
|
Measures of relative position
|
Measures of relative position compare the position of one value in relation to other values in the data set;
Percentiles and quartiles |
|
|
Percentiles
|
measure the approx percentage of values in the data set that are below the value of interest
|
|
|
find percentiles manually
|
sort the data from lowest to highest;
calculate the index point, i; if i is not a whole number, round it to the next whole number; if i is a whole number, the midpoint between i and i+1 position is our value |
|
|
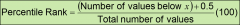
percentile rank
|
identifies the percentile of a particular value within a set of data
|
|
|
percentile rank formula
|
|
|
|
quartiles
|
split the ranked data into 4 equal groups:
the 1st quartile (Q1) constitutes the 25th percentile; the 2nd quartile (Q2) constitutes the 50th percentile (also is the median); the 3rd quartile (Q3) constitutes the 75th percentile |
|
|
Interquartile Range (IQR)
|
describes the middle 50% of a range;
find the IQR by subtracting the first quartile from the third quartile; |
|
|
Box and whisker plot
|
is a graphical display showing the relative position of the three quartiles as a box on a number line;
also shows the min and max values in the data set and any outliers |