![]()
![]()
![]()
Use LEFT and RIGHT arrow keys to navigate between flashcards;
Use UP and DOWN arrow keys to flip the card;
H to show hint;
A reads text to speech;
37 Cards in this Set
- Front
- Back
- 3rd side (hint)
|
2.4 Methods of production: Job production
|
-small scale, individual items are made that are often one-offs and customised Ad-> Staff motivated Disad-> Slow process, Labour cost, only works in a niche market. |
|
|
|
2.4 Methods of production: Batch production
|
-Involves products being made on a larger scale in groups, allowing for variations in colours, patterns and flavours. Ad-> Higher productivity, Reduced staff wages (machines), Easier to meet change in demand Disadv-> Expensive, demotivating |
|
|
|
2.4 Methods of production: Flow production
|
-On a mass scale where identical products are made, usually on a production line. Ad-> Low skilled workers, bulk buying, consistency Disadv-> Expensive, Hard to adapt to change in demand |
|
|
|
2.4 Methods of production: Cell production
|
-Setting up a production line or group working process so items can be produced flexibly. Ad->Increased communication, Staff gain skills, better quality products, quick. Disadv-> Production line is more expensive, Staff can be pushed too hard, ineffective in small scale production. |
|
|
|
2.4 Productivity
|
-Outputs(unit productivity)/ imputs per time period |
|
|
|
2.4 Factors affecting productivity |
-Investment in Tech -> More efficient -Skills levels of staff -> Better quality product -Staff motivation levels -> staff will be happier which will result in a lower labour turnover |
|
|
|
2.4 How productivity affects competitiveness?
|
-Attracts customers to you -Can lead to an increase in market share -Higher output = competitive price -Higher quality -Can meet demand of the customers |
|
|
|
2.4 Efficiency |
-A measure of the use of inputs to produce outputs, an efficient business is one that is operating at maximum output at minimum cost per unit per unit of intput |
|
|
|
2.4 Factors that affect efficiency
|
-Levels of waste in production = Saves money in the long term -Use of appropriate tech and machinery = Makes the business more efficient and staff work harder -Labour/staff = Lower labour turnover -Outsourcing = Reduced mistakes |
|
|
|
2.4 Labour intensive processes
|
-Those that require a relatively high level of staff input Adv->Multi-skilled workers, Better quality Diadv-> You have to pay workers, They have other priorities. |
|
|
|
2.4 Capital intensive
|
-Those that require a relatively high level of capital investment compared to the labour cost -Adv-> Save money in the long term, greater productivity, mass production -Disadv-> You have to employ mechanics, expensive in the short term if you don't have the investment. |
|
|
|
2.4 Capacity Utilisations |
Capacity - A firm's ability to make a product or provide a service, including their storage, availability of labour, resources and machinery. =Actual output/Maximum output x100 -Capacity utilisation describes how much of this capacity is being used at a given time in a business |
|
|
|
2.4 Consequences of under utilisation of capacity
|
-Increase waste that you cant sell -Decreased sales revenue -Cant meet customers demands -Increased cost per unit Improvement>>Be more efficient - employ more staff Increase product range -Decrease price to increase demand |
|
|
|
2.4 Consequences of over-utilisation of capacity
|
-Excess products could be wasted -Demand may not be higher enough -Staff under pressure increase mistakes reduces quality->reduce demand Improvements>> Increase working hours -Decrease amount you produce -Increase price to lower demand |
|
|
|
2.4 Stock
|
-Raw materials being held ready for production -Too little-> Not maximised profit, delays in production, decreased customer satisfaction -Too much-> Demand drops = stock left over, increased waste |
|
|
|
2.4 Stock control charts
|
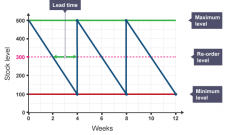
-Help a business to manage and monitor stock levels
|
|
|
|
2.4 Buffer stock
|
-The minimum stock level that a business will hold to ensure they have enough to cover any sudden increases or unexpected problems
|
|
|
|
2.4 Re-order level
|
-The stock level at which the business will place an order for new stock.
|
|
|
|
2.4 Lead times
|
-The time taken for suppliers to deliver stock when it has been ordered
|
|
|
|
2.4 Maximum stock levels
|
-The total amount of stock the business can hold
|
|
|
|
2.4 Areas where waste can be reduced
|
-Transport = minimal vehicles used -Stock = use minimal packing -Staff Waiting = Reduces workforce -Over-production = zero hour contracts, market research -Defects = change supplier -Skill level of staff = better training -Business Resources = turn lights off |
|
|
|
2.4 Time based management
|
-Minimise the time taken to complete a task Traditional approach: Design>Prototype>Create>Test Simultaneous engineering: Design> Create Prototype> Test -Quicker to produce However may require more staff who are multi-skilled = more time |
|
|
|
2.4 Quality
|
-How well a product meets the expectations of customers
|
|
|
|
2.4 Quality control
|
-Involves inspection or checking of the final product for quality Adv->Customer satisfaction increases a they keep up with demand, need less staff Disadv-> Have to pay staff more to carry out the checks, Staff are under more pressure |
|
|
|
2.4 Quality assurance
|
-Involves quality being checked at each stage of the production stage Adv-> Staff are more motivated, job enrichment, less faulty products Disadv-> Need skilled staff (training, time consuming), Longer production line |
|
|
|
2.4 Total quality Management |
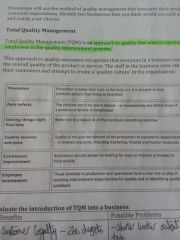
An approach to quality that aims to involve all employs in the quality improvement process
|
|
|
|
2.4 TQM benefits |
-increased customer loyalty = zero defects -improves the firms image -staff feel more motivated -increased efficiency = resources used better -staff feel more involved |
|
|
|
2.4 TQM possible problems |
-shorter worker output = train staff short term -time consuming = training needed short term increases costs -managers need to change = need to delegate |
|
|
|
2.4 Kaizen |
The business aims for continuous improvement, small and constant improvement to the production and quality control that adds up to large improvements |
This can be achieved via quality circles = staff share their ideas |
|
|
2.4 Benefits of quality circles |
Team work = improved communication between teams which will lead to the business keeping with demand Wider range of ideas as there are more opinions which will lead to improved innovation which will increase staff motivation |
|
|
|
2.4 Why Kaizen may not work? |
Ideas may clash May not work in a democratic leadership Business may be Too small Managers need to delegate Not enough staff |
|
|
|
2.4 How can quality management create competitive advantage? |
Can bring in skilled staff Higher quality More efficient = lower cost Increased training = less waste Increased customer satisfaction |
|
|
|
2.5 Inflation
|
-Sustained increase in the general price level
|
|
|
|
2.5 Causes of Inflation
|
-Demand pull = this occurs when there is an increase in demand for products in the economy which demand cannot meet. -Cost Push = An increase in the businesses costs e.g. raw materials -Measuring Inflation = measures the change of a 'basket of goods' (CPI) |
|
|
|
2.5 Exchange rates
|
-The price of one currency expressed in terms of another Effect businesses who - sell their products overseas - exports - Buy in materials - imports |
|
|
|
SPICED
|
Strong Pound Imports Cheap Exports Dear |
|
|
|
|
|
|