![]()
![]()
![]()
Use LEFT and RIGHT arrow keys to navigate between flashcards;
Use UP and DOWN arrow keys to flip the card;
H to show hint;
A reads text to speech;
37 Cards in this Set
- Front
- Back
|
Population
|
- Group of individuals of a single species living in the same general area - Described by their boundaries and size |
|
|
Density Dispersion Demographics |
- Dynamic biological processes influence what three factors of population? |
|
|
1. Extrapolation from small samples 2. Index of population size 3. Mark-recapture method |
- Methods for estimating population size and density |
|
|
Mark-Recapture Method |
- Scientists capture, tag, release random individuals
- Mixed back into population - Captures 2nd sample and notes how many are marked |
|
|
N = (s * N)/X s (first sample) n (second sample) x (marked individuals) |
Equation for Population Size (N) and what it stands for |
|
|
Environmental and social |
____ and ___ factors influence the spacing of individuals in a population |
|
|
Clumped Dispersion |
- Individuals aggregate in patches - May influenced by resource availability and behavior |
|
|
Uniform Dispersion |
- Social interactions such as territoriality may result in even distribution
|
|
|
Territoriality |
- Defense of a bounded space against other individuals |
|
|
Random Distribution |
- Dispersion pattern usually the result of decisions not made by the actual organisms |
|
|
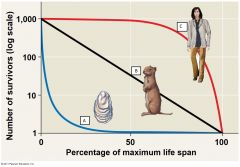
Survivorship Curves |
- Graphic ways of representing the data in a life table |
|
|
A. Type III B. Type II C. Type I |
|
|
|
Type I Survivorship Curve |
Survivorship curve where adults are pre-programmed to move out of way for offspring |
|
|
Type II Survivorship Curve |
- Curve based on luck and predation |
|
|
Type III Survivorship Curve |
- Curve consisting vulnerable offspring and low predation for adults |
|
|
Reproductive Table |
Fertility schedule; age-specific summary of the reproductive rates and their patterns in a population
|
|
|
Delta N/Delta T = B-D N: Population Size T: Time Interval B: Births D: Deaths |
Population Growth Rate Mathematical Expression |
|
|
Type I and II |
2 Types of Survivorship Curves that resemble their reproductive table |
|
|
Births + Immigrants - Deaths - Emigrants |
Change in Population Size can be determined by? |
|
|
r = b - m b: birth rate m: death rate |
Per capital rate of increase (r) equation |
|
|
Rate of growth |
- Different from population growth - Based on current sample - Sort of like compound interest |
|
|
Delta N/ Delta t = rN r: Per capita rate of increase N: Population size |
Modified expression for Change in population size |
|
|
Exponential Population Growth dN/dt = rmax * N |
- Type of population growth increase under idealized condition - Rate of increase is at maximum - What is its expression? |
|
|
Logistic Growth Model dN/dt = rmax * N * [(K-N)/K] K: Carrying capacity |
- Describes how population grows more slowly as it nears carrying capacity - Per capital rate of increase declines as carrying capacity is reached - What is its expression? |
|
|
Carrying capacity |
- Maximum population size the environment can support - Varies with the abundance of limiting resources |
|
|
When half of the carrying capacity is reached |
Number of NEW individuals start decreasing when during logistic growth?
|
|
|
Carrying Capacity (K) |
- Can be overshot, but returns to stable density - Can be difficult to define because of population fluctuation |
|
|
Allee Effect |
- When individuals have a more difficult time surviving or reproducing in the population size is too small |
|
|
Logistic Model |
- Fits few real populations but is useful for estimating possible growth - Conservation biologists use this to estimate critical size below which populations may become extinct |
|
|
Life History |
- Comprises traits that affect its schedule of reproduction and survival - These traits are evolutionary outcomes reflected in the development, physiology and behavior of an organism |
|
|
- Age at which reproduction begins - How often organisms reproduces - How many offspring are produced each cycle |
3 Types of traits comprising an organism's life history |
|
|
Semelparity |
- "One-shot" big-bang reproduction - May be related to Type I survivorship - Favored by highly variable and unpredictable environments |
|
|
Iteroparity |
- "Multiple chances" repeated reproduction |
|
|
K-Selection |
- Density dependent selection; selects for life history traits that are sensitive to population density - Usually predators - Birth rates fall and death rates rise with density |
|
|
r-selection |
- Density independent selection; selects for life history traits that maximizes reproduction - Birth/death rate does not change with population density - Usually prey |
|
|
Density Dependent |
- Population that is influenced by negative feed back - Factors such as competition, resources, disease, predation, territoriality, toxic waste and other intrinsic factors |
|
|
- Quality of food - Amount of food - Amount of predators - Weather |
4 Factors that affect stability/fluctuation of populations |