![]()
![]()
![]()
Use LEFT and RIGHT arrow keys to navigate between flashcards;
Use UP and DOWN arrow keys to flip the card;
H to show hint;
A reads text to speech;
51 Cards in this Set
- Front
- Back
|
what are chromatography techniques used for? |
to separate one molecule from another |
|
|
chromatography techniques |
1. used to separate one molecule from another 2. different techniques used for different molecules
|
|
|
types of chromatography |
1. protein chromatography 2. column chromatography (HPLC) 3. gas chromatography 4. thin layer/paper chromatography |
|
|
protein chromatography |
1. utilizes acrylamide gels and column chromatography 2. various matrices separate proteins based on charge, size or affinity for matrix |
|
|
HPLC |
1. high pressure liquid chromatography 2. type of column chromatography 3. done at higher pressure to speed up the process |
|
|
gas chromatography |
1. volatilizes liquids 2. separates the molecules as a gas |
|
|
thin layer/paper chromatography |
separates smaller molecules |
|
|
agarose gel electrophoresis |
1. separates DNA or RNA fragments 2. based on size of the fragment
|
|
|
agarose |
1. derived from sea weed 2. polysaccharide 3. consists of long polymer comprised of alternating D-galactose molecules and a molecule similar to L-galactose 4. powder that will dissolve at near boiling temperatures 5. solidifies when agar cools below 40deg 6. long polymers create a matrix which contains pores between the linear strands |
|
|
pore size |
1. depends on the concentration of the agarose in the gel 2. vary from 50 nm to more than 200 nm depending on agar concentration 3. researcher controls size by varying the percent of agarose in gel
|
|
|
higher precent of agarose |
the smaller the pores between strands |
|
|
casting a gel |
1. agarose is lightly boiled to dissolve the agarose 2. allowed to cool to about 60 degrees 4. agarose must cool significantly before pouring gel (may warp tray if gel is too hot) 5. combs (differ in size) placed in casting tray 6. pour gel 7. gel solidifies 8. creates wells for holding DNA sample 9.
|
|
|
typical range of agarose in buffer? |
0.5% - 1.8% |
|
|
how does DNA migrate? |
1. Electric field causes DNA to migrate to positive pole 2. migrates through pores created by the agarose matrix 3. small pores migrate more quickly |
|
|
electric field |
1. allows DNA to migrate 2. DNA migrates to positive pole |
|
|
why does DNA move to positive pole? |
because DNA has a negatively charged phosphate backbone |
|
|
fragment size: which moves faster? |
1. small fragments of DNA move more easily and quickly 2. large fragments move much more slowly |
|
|
which gels are better for resolving high molecular weight fragments? |
low percentage gels |
|
|
which gels are better for resolving low molecular weight fragments? |
high percentage gels |
|
|
low percentage gels |
better for resolving high molecular weight fragments |
|
|
high percentage gels |
better for resolving low molecular weight fragments |
|
|
running a gel |
1. DNA samples placed in loading buffer 2. pipet in gel 3. run at a voltage b/w 30 - 120 V |
|
|
what is the loading buffer we use? |
10X stop buffer aka "blue juice" |
|
|
loading buffer |
1. 10X stop buffer ("blue juice") 2. loading buffer 3. used to prepare the gel for a run 4. contains glycerol (makes it heavier) 5. contains SDS (sharpens bands and gives better resolution) 6. contains bromophenol blue (adds color that matches same rate as a ~500 bp DNA fragment) |
|
|
blue juice |
loading buffer 10 X stop buffer |
|
|
why does loading buffer contain glycerol? |
1. to make DNA sample heavier than water 2. allows DNA to stay in well if properly pipetted |
|
|
why does loading buffer contain SDS? |
sharpens bands --> gives better resolution |
|
|
why is bromophenol blue contained in the loading buffer? |
1. adds a colored band 2. migrates on the gel at the same rate as a ~500 bp DNA fragment |
|
|
what does the loading buffer contain? |
1. glycerol 2. SDS 3. bromophenol blue |
|
|
running voltage |
1. b/w 30-120 V 2. higher voltage = runs quicker 3. slower voltage = better band quality |
|
|
pro and con of a higher voltage |
1. quick results 2. lower quality (for publication) |
|
|
pro and con of a lower voltage |
1. slow results 2. higher quality (for publication) |
|
|
gel staining |
1. gels must be stained to visualize bands of DNA 2. stains bind to DNA and fluoresce under UV light 3. EtBr is a common stain 4. other common stains: Sybr Green, Sybr gold, GelRed |
|
|
EtBr |
1. used to stain gels 2. allow bands to be detected under UV light 3. intercalating agent (mutagen)
|
|
|
how does EtBr allow bands to be detected under UV light? |
EtBr intercalates into the DNA ladder --> fluoresce |
|
|
non mutagenic gel stains |
Sybr Green, Sybr gold, GelRed |
|
|
standards |
1. needed whenever you want to know the molecular weight of DNA fragments 2. fragments of a known base pair number 3. allows "calibration" of the gel 4. need one on every gel we run 5. common ladders: 100 b.p, HindiII digest of Lambda Phage DNA |
|
|
100 bp ladder |
fragments: 100bp, 200bp, 300 bp |
|
|
HindIII digest of Lambda Phage DNA |
1. Hind III digest of Lambda Phage DNA 2. most common standard 3. viral genome from Lambda Phage isolated 4. cut with restriction enzyme HindIII 5. yields DNA fragments of knowno molecular weights (base pairs) |
|
|
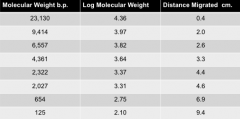
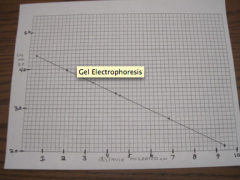
standard curve |
1. generated to allow you to determine the number of base pairs in any band of your gel 2. Log MW (bp) v distance migrated (cm/mm) 3. takes advantage of the fact the small fragments will migrate farther than larger ones 4. logarithmic relation bw size and distance migrated 5. must measure from the origin to center of each band in the standard lane |
|
|
knowing the MW of the standard allows us to what? |
plot the standard curve |
|
|
standard curve axises |
Log MW (bp) v Distance Migrated (cm/mm) |
|
|
origin of the well |
bottom of the well |
|
|
how to generate a standard cureve |
plot log MW of each band vs distance each band migrated
|
|
produce a standard curve |
|
|
|
what do we do after we generate a standard curve? |
measure how far the bands of the digest have migrated |
|
|
what can you do after you know the distance each band migrated on the gel? |
use the curve to determine the MW of each band |
|
|
how to determine the MW of each band after knowing the migratory distance? |
1. Find the distance on the X-axis 2. go up the graph until you make contact with the standard curve 3. find what the y-axis reads at that point of contact 4. take the inverse log of the Y value 5. you will now have the MW value of the band |
|
|
pictures**** |
*** |
|
|
what do we need to construct a restriction site map? |
base pair size of the ScaI, BglI and double digests DNA |
|
|
what can we do after knowing the base pair size of the DNA fragments cut by Sca1, Bgl1 and double digests? |
construct a restriction site map |