![]()
![]()
![]()
Use LEFT and RIGHT arrow keys to navigate between flashcards;
Use UP and DOWN arrow keys to flip the card;
H to show hint;
A reads text to speech;
40 Cards in this Set
- Front
- Back
|
Different versions of the DNA sequence at a particular locus |
Alleles |
|
|
Mutations that are carried by some but not all individuals of the population |
Polymorphism |
|
|
A population that is not evolving shows allele and genotype frequencies that are in |
Hardy Weinberg Equilibrium |
|
|
If population is NOT in Hardy-Weinberg equilibrium, it can be concluded that the population is ___________ |
Evolving |
|
|
T/F: A hardy-weinberg population is NOT evolving |
True |
|
|
If a population is in a hardy-weinberg equilibrium what can you say about the population evolving? |
The population is not evolving |
|
|
What are the requirements for a population be in Hardy Weinberg? |
1. Random mating 2. Large population size 3. No Mutations 4. No natural selection 5. No migration |
|
|
What are the requirements for a population to be evolving? |
1. Inbreeding & Other 2. Genetic drift 3. Mutations 4. Natural selection 5. Migration |
|
|
What ist he Hardy-Weinberg equilibrium equation? |
P= dominant allele (A) q= recessive allele (a) P+q=1 P^2+2Pq+q^2=1 |
|
|
Explain what each component of the Hardy-Weinberg Equilibrium equation represents. |
P^2+2Pq+q^2 P^2= Homozygous dominant allele 2pq = Heterozygous Allele q^2= Homozygous recessive allele |
|
|
Use the Hardy-Weinberg equilibrium to determine the genotypic frequency given the Allele frequency: A=0.8 a=0.2 |
p=0.8 ; q=0.2 p^2+2pq+q^2=1 p^2->0.8^2=0.64 2pq->2(0.8x0.2)=0.32 q^2->0.2^2=0.04 |
|
|
Determine the allele frequency given the following: AA=120 Aa=60 aa=35 |
#A = 2*AA + Aa #A=2*120 +60 #A= 240+60 #A=300 #A=300/430 #A=0.70 #a=2*aa+Aa #a=2*35+60 #a=70+60 #a=130 #a=130/430 #a=0.30 |
|
|
Determine the genotype frequency given the following: AA=120 Aa=60 aa=35 |
Proportion A= 120/215 Proportion A= 0.56 Proportion Aa= 60/215 Proportion Aa=0.28 Proportion aa=35/215 Proportion aa=0.16 |
|
|
What is the number of occurance of PKU? |
1 per 10,000 births |
|
|
T/F: Rare deleterious recessives often remain in a population because they are hidden in the heterozygous state? |
True |
|
|
What is the frequency of carriers (heterozygotes) of the deleterious allele given that the occurance of PKU is 1 per 10,000 births given that hardy-weinberg is occuring |
q^2=1/10000 q^2=0.0001 q=0.01 p=1-q p=1-0.01 p=0.99 2pq=2*0.99*0.01 2pq=0.0198 |
|
|
Does hardy-weinberg often occur in real life? |
No |
|
|
How would you know if evolution is occuring using Hardy-Weinberg? |
If there is a deviation from hardy-weinberg than that indicates evolution is happening |
|
|
How can you tell whether a population is out of hardy-weinberg equilibrium |
1. When allele frequencies are changing across generations 2. When you cannot predict genotype frequencies from allele frequencies (means there is an excess or deficit of genotypes thanw hat would be expected given the allele frequencies |
|
|
Which of the following are strong mechanisms for evolution? A. Inbreeding & population substructure B. Genetic Drift C. Mutations D. Natural selection E. Migration |
D. Natural Selection |
|
|
Explain why inbreeding and population substructure a weak mechanism of evolution |
Recovers hardy weinberg equilibrium in 1 generation |
|
|
Explain why mutations are weak mechanisms of evolution |
Very tinychange in allele frequencey (1/2N) |
|
|
Explain how migration is a weak mechanism of evolution? |
Small change in allele frequency |
|
|
What are the 4 major evolutionary mechanisms? |
1. Genetic Drift 2. Natural Selection 3. Mutation 4. Migration |
|
|
A population in hardy-weinberg equilibrium exhibits the following numbers of genotypes for locus: 32 BB, 16 Bb, and 2bb. The frequency of allele b is: A. 0.04 B. 0.08 C. 0.2 D. 0.36 E. 0.8 |
C. 0.2 2+1/2(16)->2+8=10 10/50=1/5 0.2 |
|
|
When does selection happen? |
When individuals with particular phenotypes survive to reproductive age at higher rates than individuals with other phenotypes.
|
|
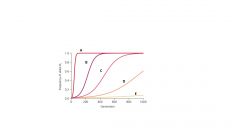
The graph indicates the frequency of Allele B over 1000 generations. Which of the line graphs most accurately describes an event that would most commonly occur in nature? |
E. This would most likely occur in nature as large shifts of allele frequencies are uncommon. Even very small differences in survival rate an lead to substantial change in allele frequency. If differential survival is maintained for generations. |
|

Referring to the graph, explain why lines A-D are rare in nature |
These are rare because this type of selection is very strong. In this graph 75% of heterozygotes survived while 50% homozygotes survives |
|
|
The ___________ the difference in survival, the faster the evolution |
Larger |
|
|
Why did Darwin have concerns in regards to Natural Selection. Think in terms of genetic diversity. |
Darwin knew that if Natural Selection were allowed to continue to completion, it would invariably remove a trait from a population reducing genetic variation in the species. Without knowing what exactly promoted genetic variation in a species, he was worried that if Natural Selection were the only application than all genetic variations would be eliminated, which he knew was impossible given his findings. |
|
|
What would happen if a given populations allele frequency were the following: P=1 Q=0 |
The allele represented by P would be fixed and subsequently evolution would stop |
|
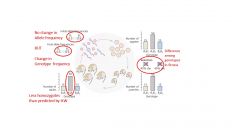
Explain what is happening in the given figure. |
This is an example in which heterozygosity is being selected. This violates the second conclusion of Hardy-Weinberg which states "You can tell genotype frequencies from allele frequencies, and vice versa". Based on the figure you have an initial allele frequency of B=0.5, b=0.5 and a final allele frequency of B=0.5, 0.5 however you see a change in the Genotype frequency. Based on the allele frequency the final genotype frequency should be the same as the initial which is not the case. |
|
|
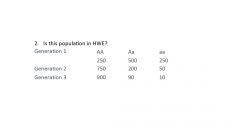
No, because the allele frequency is increasing towards AA. This violates the first conclusion f Hardy-Weinberg equilibrium "Allele frequencies do not change across generation" Since the allele frequencies are changing across generations we can assume that this is not in Hardy-Weinberg and so this is evolving. |
|
|
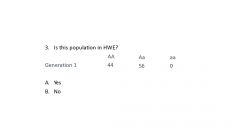
No, you can't tell if this is in Hardy-Weinberg with only one generation. However, since the homozygous recessive allele is missing in the population suggests that this trait is lethal. This suggests a negative selection acting against (aa). |
|
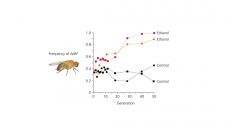
Using the image, what can you tell about the control group compared to those that are ethanol. |
This is to test the allele Adh in the presence of two environments, the control and the ethanol spiked food. We see that in the presence of ethanol, the frequency of Adh in subsequent generations increased. Thus the line indicating the ethanol group is under selection for the allele while the control group is undergoing no selection and likely remains in Hardy-Weinberg. |
|
|
Explain the evolution of HIV resistance in the human population |
CCR5-delta32 is a mutant allele of the receptor CCR5, where the deletion of a 32 base pair segment makes the receptor nonfunctional. The allele has a negative effect upon T cell function, but appears to protect against smallpox and HIV. HIV has no receptor to bind to and cannot enter the cell. This allele is found in 14% of Europeans. HIV can impose selective pressure for CCR5-delta32, increasing the frequency of this allele in human populations. |
|
|
Will the frequency of CCR5-delta32 increase in frequency given the following scenario: 1. High initial frequency of delta-32 2. High selection pressure, high rate of infection |
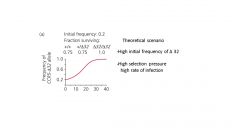
With a high initial frequency of delta-32 and high selection pressures this will likely result in a small increase in fitness of delta-32/delta-32 thus increasing in the number of HIV resistant recipients. |
|
|
Will the frequency of CCR5-delta32 increase in frequency given the following scenario: 1. High initial frequency of delta-32 2. Low selection pressure, low rate of infection |
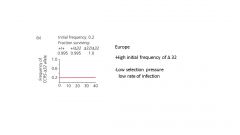
Without a high selection, any type of differences in terms of fitness will be very small thus minimal changes will be seen as generations progress. |
|
|
Will the frequency of CCR5-delta32 increase in frequency given the following scenario:1. High initial frequency of delta-322. High selection pressure, high rate of infection |
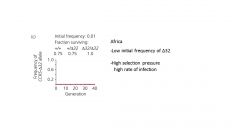
When the initial frequency of delta-32 is low, most copies are in heterozygotes. Since heterozygotes are susceptible, the benefit of delta-32 are hidden from selection. |
|
|
Kuru is a disease that has been known to affect young women in a given tribe. Explain what has been found in regards to genotypic frequencies? |
heterozygous females have been shown to be resistant to Kuru while homozygote females have been shown to be susceptible to Kuru. This suggests a selection for the heterozygote genotype. This violates Hardy-weinberg's 2nd conclusions "you can tell genotype frequencies from allele frequencies, and vice versa" the predicted genotype frequencies are not that what is shown. This suggests that evolution is occurring. One other reason that there is a greater number of heterozygotes to homozygotes suggests that infants who were born homozygotes and from Kuru mothers did not survive. Those few that did survive were likely born from non-Kuru mothers. |