![]()
![]()
![]()
Use LEFT and RIGHT arrow keys to navigate between flashcards;
Use UP and DOWN arrow keys to flip the card;
H to show hint;
A reads text to speech;
38 Cards in this Set
- Front
- Back
|
What formula is used to determine broad-sense heritability? |
Vg/Vp Vg= Genetic Variance Vp= Phenotypic Variance Vg/Vg+Ve |
|
|
What formula is used to determine Phenotypic Variance (Vp)? |
Vp= Vg+Ve Vg= Genetic variance Ve= Environmental variance |
|
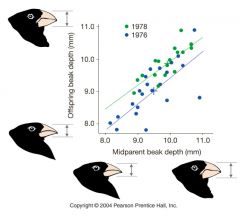
What can you confer about this image |
This trait (beak depth) is highly heritable. |
|
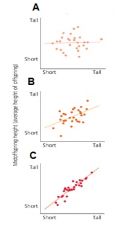
Which graph demonstrates a trait with the lowest genetic components, implying tha variations are due to environment |
A |
|
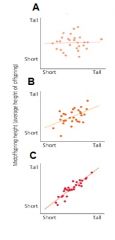
Which graph demonstrats the greatest heritability |
C |
|
|
What formula is used to determine narrow-sense heritability? |
H2 Va/Vp Va=Additive variance Vp= Phenotypic variance Va/(Va+Vd+Vi+Ve) Vd= Dominance variation Vi=Interaction genetic variation (Can be ignored) Ve = Environmental variatio |
|
|
What is the range of narrow-sense heritability? |
0-1 |
|
|
What is the difference between broad sense heritability and narrow-sense heritability? |
Narrow sense heritability is just the additive genetic variation, while broad sense heritability is the overall genetic variation |
|
|
What are the components of genetic variance Vg? |
Va: Additive Variance Vd: Dominance variance Vi: Interaction (Or epistatic) variance |
|
|
Define: Additive genetic variance (Va) |
Genetic variation attributed to average differences between different allelic characters. Or, deviation from the mean phenotype due to the inhertiance of a particular gene |
|
|
Define: Dominance Genetic Variance (Vd) |
Variance due to heterozygotes not being exact phenotypic midpoints of homozygote parents (i.e., the effect of dominance relationships on phenotypes) |
|
|
Define: Interaction (or epistatic genetic variance (Vi) |
Varience due tot he interaction of alleles from (a gene at) a different - epistatic - locus influencing phenotype |
|
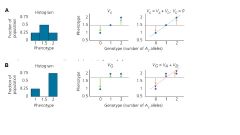
Which graph shows only additive variation? |
A |
|
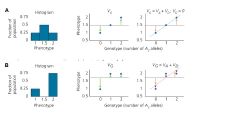
Which graph shows dominance variation |
B |
|
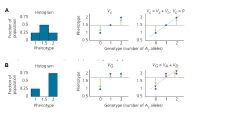
How can you tell that graph A can be explaiend by additive variation? |
The fraction of total genetic variation is statisticallyexplained by a best-fit line. |
|
|
T/F: if H^2 is 0 than none of the phenotypic variation among individuals are due to genetic differences among individuals (all environment) |
True |
|
|
T/F: If H^2 is 0 than that means that genes do not "determine" the phenotype |
False. if H^2 is 0 it does not mean that genes do not determine the phenotype, only that none of the phenotypic variations are due to the genetic differences but by environmental differences. |
|
|
If the heritability of a gene is 0 is it correct to assume that the trait is not heritable? |
No. A heritability of 0 implies that the variations of that trait may not be explained by genes. (ex. All humans are bipedal walkers which is a trait shared by all humans and there are no variations in this trait so that technically means that heritability is 0. However, that doesn't mean that bipedalism is not encoded by the genes, it simply means the variations may not be explained by the genes and perhaps by some environmental factor) |
|
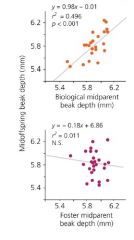
Describe this graph |
The graph shows that heritability is in action. The first graph represence a strong correlation in beak depth between biological birds and their offspring. The second shows a weak correlation of beak depth between offspring and foster parent birds. This shows that beak depth is heritable because it falls on a best fit line. If they were not heritable than we would see a strong correlation between the offspring and the foster parents implying that correlation may be due to something other than heritability, but since this is not the case we know that beak depth is heritable. |
|
|
What are the two methods used to quantify the strength of selection? |
1. Selection Differential (S): The difference between the mean of the selected individuals and the mean of the entire population 2. Selection Gradient: The slope of the regression of relative fitness on phenotype. |
|
|
You are trying to breed mice for longer tail length and so you start selecting mice with 9cm long tails or longer to breed and continue this for many generations. Over time you wanted to determine if your selection yielded results. Knowing that the total population's average length is 9.4 and the average length of the selected population is 10. Determine the selection differential |
10-9.4=0.6 0.6 is the selection differential |
|
|
What are the steps to create a selection gradient |
1. Assign absolute fitness 2. Calculate mean fitness 3. Calculate relative fitness 4. Make scatter plot 5. Calculate slope |
|
|
What is the formula used to find selection gradient |
Selection gradient = selection differential/variance |
|
|
What is the formula used to find selection differential |
Selection differential = Selection gradient * variance |
|
|
Define: Evolutionary Response
|
The change in the mean phenotype of the population over one (or more) generations |
|
|
What is the formula used to calculate evolutionary response? |
R=H^2*S H^2=Heritability S=Selection differential Also R= (mean of the gen 1 population) - (mean of gen 0 pop) |
|
|
Imagine that you are a farmer and that you are trying to grow large beans. You're current mean bean weight is 404mg and you begin selecting the top 10% of this population to grow for your next crop. This selected population mean bean weight is 692mg. After one generation, the total mean bean weight is 609. Determine the Selection Differential and Response differential. What percent of the new population mean bean weight was due to genetic factors? |
Selection Differential (S)= Mean selected-Mean whole pop S=692-404 S=288 Response Differential (R)= mean of whole gen 1- mean of whole gen 0 R=609-404 R=205 Heritability (H^2) = R/S H^2=205/288 H^2=0.71 71% of the variation in bean size was due to genetic factors. |
|
|
Imagine that you are a farmer and that you are trying to grow large beans. You're current mean bean weight is 404mg and you begin selecting the top 10% of this population to grow for your next crop. This selected population mean bean weight is 692mg. After one generation, the total mean bean weight is 609. What would have occured if the variation in bean size was entirely due to environmental effects? |
The mean bean size would have remained unchanged (404mg) |
|
|
Imagine that you are a farmer and that you are trying to grow large beans. You're current mean bean weight is 404mg and you begin selecting the top 10% of this population to grow for your next crop. This selected population mean bean weight is 692mg. After one generation, the total mean bean weight is 609. What would have occured if all of the variation was controlled by genetic factors? |
The mean bean size in generation 1 would have been 692 mg (the selected mean) |
|
|
What do you know about the Evolutionary response if your heritability is 0 |
Evolutionary response would be 0. |
|
|
why is knowing heritability important? |
It allows us to predict a trait's response to selection |
|
|
In a population of birds with a mean beak depth of 8.82mm you observe a random extinction event leaving only a few birds left. The mean beak depth of these remaining birds is 10.11. Predict the mean beak depth of the Gen 1 offspring of the surviving birds. Your heritability value is 0.72 |
1. First find selection differential S=selected-initial S=10.11-8.82 S=1.29mm 2. Find your evolutionary response R=H^2*S R=0.72*1.29 R=0.93 3. Use the evolutionary response to determine the mean of the gen 1 R=(Mean of Gen1)-(mean of gen0) R+(Mean of gen0)=Mean of Gen1 Mean of Gen1=0.93+8.82 Mean of Gen1=9.75mm |
|
|
Which of the following modes of selection indicates that one extreme phenotype has the highest fitness? A. Directional B. Stabilizing C. Disruptive |
A. Directional |
|
|
Which of the following modes of selection indicates that the intermediate phenotype has the highest fitness A. Directional B. Stabilizing C. Disruptive |
B. Stabilizing |
|
|
Which of the following modes of selection indicates that both extremes of phenotypes has the highest fitness? A. Directional B. Stabilizing C. Disruptive |
C. Disruptive |
|
|
When looking at the predation of gals againt flies and birds. What type of mode was seen to represent this example |
Stabilizing selection |
|
|
When looking at the Black-bellied seedcracker, what mode best represented the selection of seeds |
Disruptive selection |
|
|
An average bean weight is 404 mg. We select 10% of the population for next year's crop with an average weight of 692 mg. Following season, the mean of the crop from the selected group is 400mg. What can we conclude? A. The variation in bean weight is mostly controlled by genetic factors B. The bean weight will increase next generation C. The variation in bean weight is mostly due to environmental factors D. Response to selection (R) is 288g E. Heritability of bean weight is relatively high |
C. The variation in bean weight is mostly due to the environmentla factors. (Since the bean weight essentially stayed the same we assume that heritability is 0 meaning that variation cannot be explained by genetics and that it is explained by environmental variances) |

