![]()
![]()
![]()
Use LEFT and RIGHT arrow keys to navigate between flashcards;
Use UP and DOWN arrow keys to flip the card;
H to show hint;
A reads text to speech;
14 Cards in this Set
- Front
- Back
|
Approaches to Ecology |
Observations Experiments Models |
|
|
Observations - Advantages and Disadvantages
Examines relationship between exposure and outcome with population-level rather than individual level data. (Defines group by place, time, or both) |
Advantages - Inexpensive, Less time consuming, Simple and easty to understand, Examines community group or national level data or trends.
Disadvantages - Lead to ecology fallacy (mistaken belief) which infers to association at the population level whereas one may not exist at the individual level, Difficult to detect complicated cause-effect relationships. |
|
|
Experiment - Advantages and Disadvantages Manipulates one or more variables to measure cause/effect on another variable. |
Advantages - Objective, Reliable, Replicable, Internal Validity, Researcher controls all extraneous variables and only that variable influences results of experiment. Disadvantages - Lacks external and ecological validity (the extent to which results of study can be generalized to other situations and people), Non-realistic conditions |
|
|
Types of Ecological Experiments |
Field Experiments - Real Life (Natural Settings), where experiment/environment (independent variable) is intentionally manipulated. Natural Experiments - Quasi Experiement, when researcher takes advantages of naturally occuring independent variable. Lab Experiments - Occurs within a lab with full manipulation and under replicated environmental situations. |
|
|
Models - Advantages and Disadvantages Tool for predicting distribution and abundance. Formalize a set of assumptions to make testable predictions. |
Advantages - Can affect entire populations, Provied a framework that provides many options for interventions. Disadvantages - Lack of specificity of hypothesized influences (Hard to identify critical factors), Lack of how broader levels/factors influence operations of how variables interact, Need better operational models to hypothesize. |
|
|
Scientific Method as applied in ecology Process is iterative (repetitive) and self-correcting. |
1. Make observations and ask a question. 2. Use previous knowledge to develop a hypothesis. 3. Evaluate hypothesis by experimentation, observational studies, or quantitative models. 4. Use results to modify hypotheses, pose new questions, or draw conclusions about the natural world. |
|
|
What are the features of a good experiment? |
Unambiguous interpretation of causality is dependent on several requirements: 1. Appropriate controls 2. Meaningful experiments 3. Replication of independent units 4. Randomization and interspersion of treatments |
|
|
Develop an experiment with features of a good experiment. (1) |
|
|
|
Develop an experiment with features of a good experiement. (2) |
|
|
|
How do you evaluate evidence? Analysis involves rejecting a statistical null hypothesis (nothing is ever "proven"). |
1. Visualizations are useful a. Bar Graph - Categorical (X) and Continuous (Y) b. Scatterplot - Continuous (Both X and Y) 2. The importance of Variance a. Variance around the mean. 3. Statistical Analysis is required a. Biological vs. Statistical Significance b. Statistical Test |
|
|
What is a p-value? |
1. The P-Value is the bottom line. P is the probability of obtaining your results simply by chance. Smaller values (below 0.05) are better - 0.01 = "1% due to chance". P<0.05 (below) - Reject Null P>0.05 (above) - Accept Null |
|
|
Biological vs. Statistical Significance? |
The presence of mammals significantly reduced grasshopper abundances (Biological) VS. Mammals reduced grasshopper abundances by 25%, but nitrogen fertilizer applied to plants increased grasshoppers b 100%. (Statistical) Bio - Pertaining to body Stats - Pertaining to numbers |
|
|
How do you choose the appropriate statistical test? |
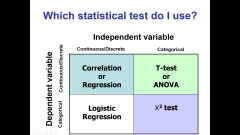
Independent - X Dependent - Y |
|
|
Physical Environment |
A |