![]()
![]()
![]()
Use LEFT and RIGHT arrow keys to navigate between flashcards;
Use UP and DOWN arrow keys to flip the card;
H to show hint;
A reads text to speech;
14 Cards in this Set
- Front
- Back
|
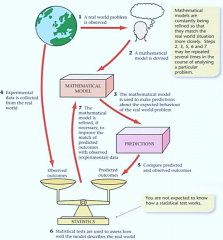
Mathematical models
|
|
|
|
Types of data |
There are two types; qualitative and quantitative. Qualitative :- non-numerical observations. Quantitative :- numerical observations. ------------------------------------------- There are two types of quantitative data; discrete or continuous.
Continuous :- can take any value in a given range.
Discrete :- can only take specific values in a given range. |
|
|
Mean median and mode |
Mode :- the most common value that occurs Median :- the middle number when put in order Mean :- add all up & divide by how much there are. ------------------------------------------
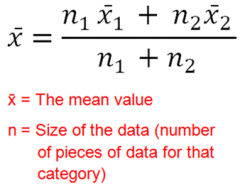
When calculating combined means, use the equation; |
|
|
Measures of location |
Measure of location= average. (mean, median and mode)
You should know when to use the right type of average in each situation . Mode :- This is used when data is qualitative. You shouldn’t use the mode when there is only one value of each number. Median :- this is used in quantitative data. It’s usually used when there are extreme values.
Mean :- this is used for qualitative data. Mean includes all of the pieces of data, therefore, gives a true measure of the data. However, this means that it is affected by extreme values. |
|
|
Calculating median in a discrete data table |
MEDIAN
1.To calculate the median, first work out the cumulative frequency. 2.Then ½ the total frequency. 3.Then find the cumulative group that ½ the frequency is in. 4.Then take the ½ value, away from the total frequency, before that group. That is the ‘nth value’. 5.Then divide the ‘nth value’, from the median groups’, frequency.
6.Then times that answer by the class width of the median group. (remember the point 5’s in the group width.) |
|
|
Types of data |
There are two types; qualitative and quantitative. Qualitative :- non-numerical observations. Quantitative :- numerical observations. ------------------------------------------- There are two types of quantitative data; discrete or continuous.
Continuous :- can take any value in a given range.
Discrete :- can only take specific values in a given range. |
|
|
Calculating the mean. (both ways) |

To calculate the mean, use the equation;
Calculating the mean on a discrete data table When calculating the mean on a frequency discrete data table, the ‘x’ is the specific value/thing, e.g. colours of books, or the shirt collar size. The ‘f’ is the frequency. Calculating the mean on a grouped frequency table;
The formula is the same, however, in this case, the ‘x’ is the midpoint of the class data. So ‘fx’ means, frequency x the midpoint. The total ‘fx’ divided by the total frequency ‘f’. |
|
|
Working out quartiles |
To work out the Q1, divide the total by 4. To work out the Q3, divide the total by 4 and then times that by 3.
Continuous data tables. To work out the LOWER QUARTILE, Q1, divide n by 4 and use interpolation to find the corresponding value. To work out the UPPER QUARTILE, Q3, divide n by 4 and multiply by three and use interpolation to find the corresponding value.
Interquartile range =
upper quartile – lower quartile. |
|
|
Percentiles |
To calculate the xth percentile, Px, you find the value of the (xn/100)th term.
The n% to m% interpercentile range = Pm – Pn |
|
|
Calculating the variance and the standard deviation |
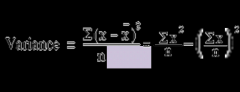
The deviation of an observation ‘x’ from the mean is given by x-x
To calculate the variance, use the formula;
x is the value and x is the mean. n is the number of values.
To calculate the standard deviation; use the formula,
(root)Variance |
|
|
Coding |
When the data values are too large, then you can use coding to make the numbers easier to work with.
To find the standard deviation of the original data, find the standard deviation of the coded data and either multiply this by what you divided by, or divide this by what you multiplied by. |
|
|
Stem and leaf diagrams and box plots. |
•It is used in order to represent data •They reveal the shape of the data and enables quartiles to be found. •Two set of stem and leaf data can be compared back to back. •
•An outlier of a set of data is an extreme value outside of the results. You may be given a rule to calculate the outlier. |
|
|
Box plots |
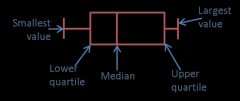
•Box plots represent important features of the data, such as the minimum and maximum quartiles, the median and the largest and the smallest value.
•Example of boxplots. |
|
|
Skew – ness |
Diagrams measures of location and measures of spread can all be used to describe the skewness of the data. |