Reading...
![]()
Play button
![]()
Play button
![]()
Use LEFT and RIGHT arrow keys to navigate between flashcards;
Use UP and DOWN arrow keys to flip the card;
H to show hint;
A reads text to speech;
33 Cards in this Set
- Front
- Back

1.
The graph above represents _________________________ curves? |
Indifference
|
|

2.
Among points A, B, C, and D, which combination of wings and hamburgers yields the highest level of satisfaction? _______________ Wings _______________Hamburgers |
B) 9 wings and 8 Burgers
|
|

3.
Among points, A, B, C, and D, which combination of wings and hamburgers yields the lowest level of satisfaction? _______________Wings ______________Hamburgers |
D) 3 wings and 5 burgers
|
|

Given points A and B, how many wings is this consumer willing to give up in order to obtain one additional hamburger?
|
B) -1/2
|
|
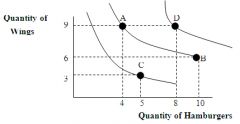
What is the technical name of the ratio described above?
|
A) MRS
|
|

Which of the following statements is true?
|
B) When total utility reaches a maximum, marginal utility is zero.
|
|
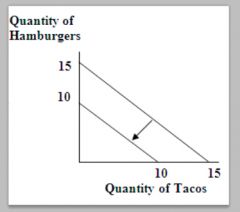
The shift in the budget line in the graph is due to ___________________________?
|
D) Consumer Income decreased
|
|
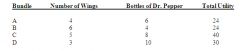
According to the chart, which bundle is preferred
|
C
|
|

Which of the following is true?
|
The Law of Diminishing Marginal Utility states that our additional satisfaction declines as more of a good is consumed
|
|
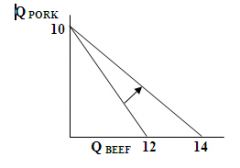
The counterclockwise rotation in this diagram resulted from a ______________________________?
|
D) Decrease in the Price of Beef
|
|
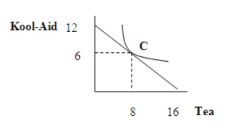
If the price per glass of Tea is $3.00 and the price per glass of Kool-Aid is $4.00, then the budget for this consumer is ______________________?
|
$48.00
|
|

As demonstrated in the graph, the combination of 6 glasses of Kool-Aid and 8 glasses of tea represent a consumer's __________________________.
|
Equilibrium Quantity
|
|

When interpreting the diagram above one could conclude that:
|
C) Mu Kool Aid = Mu Tea
P Kool Aid P Tea |
|

This diagram technically is called a (an) ________________ curve
|
Engel Curve
|
|
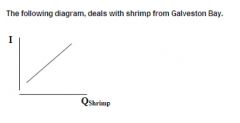
From this diagram, we can conclude that shrimp from Galveston Bay is a ____________________ good
|
Normal
|
|
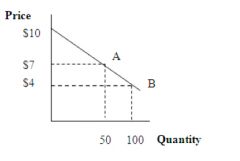
Consumer surplus at a price of $7.00 is equal to _______________?
|
) $75.00
|
|

The economic well being of consumers in this market would increase by _________ dollars if the market price decreased by $3.00
|
$225.00
|
|

The increase in quantity as demonstrated by the movement from point A to B along the demand curve is referred to as a __________________________?
|
Change in Quantity demanded
|
|
In the following graph, line CAB is referred to as a ___________________________?
|
Consumer Demand Curve
|
|

The increase in consumption of hamburgers brought about by the decrease in price as demonstrated from point A to B, resulting in more buying power for the consumer is referred to as ___________________________
|
income Effect
|
|

Own Price-elasticity of demand is determined dividing the percent change in quantity by
|
Percent change in price
|
|

The own price-elasticity of demand for this good from $5.00 to $3.00 is:
|
-.50
|
|

The own price-elasticity coefficient above indicates a ___________________ type of demand
|
Inelastic
|
|

with regard to economic well being, the consumer will be _______ as the price decreases?
|
Better off
|
|

The producer revenue at $5.00 is __________?
|
$350.00
|
|
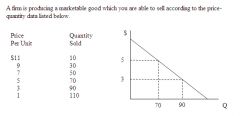
As a result of the producers decision to decrease the price, the producers total revenue will __________________?
|
Decrease by $80.00
|
|
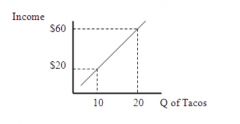
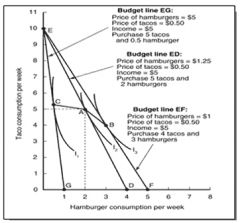
In the graph above, the Income elasticity for tacos is ______________________?
|
.67
|
|

Tacos in this case would be considered a ________ good
|
Normal-Necessity
|
|

How many platters will the Dixie chicken sell
|
1240
|
|

The Dixie Chicken's revenue will _____________
|
Decrease by $290.00
|
|
|
_____________is a schedule that shows how many units of a good the consumer will purchase at different prices for that good during some specified time in a specified market, all other factors held constant or equal.
|
Demand Curve
|
|
|
_______________ reflects what $1.00 today would have purchased in goods and services in comparison to a particular base period.
|
Purchasing Power
|
|
|
___________________ is defined by the income available for consumption and the prices that consumer faces.
|
Budget Constraint
|