![]()
![]()
![]()
Use LEFT and RIGHT arrow keys to navigate between flashcards;
Use UP and DOWN arrow keys to flip the card;
H to show hint;
A reads text to speech;
42 Cards in this Set
- Front
- Back
|
1) object 2) variable 3) observations |
2) characteristic that assumes different entities 3) different values of a variable measured |
|
|
Raw data |
Unprocessed data |
|
|
Time series data |
A sequence of measurement s collected on the same element for the same variable for different periods |
|
|
Misus of statistics |
Inappropriate method, unrepresentative subgroups to study,inappropiate summarizing.. ect |
|
|
Cross sectional data |
Measurements taken on a group of individuals at the same time |
|
|
Longitudinal data |
Measurements taken on a group of objects at regular intervals of time to provide information about changes |
|
|
Secondary data |
Second hand information . Information collected by someone else |
|
|
Adv s of secondary data |
Time saving Accessibility Saving of money Feasibility of both longitudinal and international comparative studies Generating new insights |
|
|
Dis advs of secondary data |
Inappropriateness of the data Lack of control over data quality Required data may not be available Data may be out of date |
|
|
Advs of primary data |
Targeted issues are addressed Data interpretation is better Recency of data Proprietary issues Data is away safe from competitors |
|
|
Disadvantages of primary data |
High cost Time consuming Inaccurate feed backs(bias) More number of resources required |
|
|
What are the types of variables? |
Quantitative(discrete and continuous) Qualitative(nominal and ordinal) |
|
|
Define quantitative |
Are variables that yield measurable values or scores and frequencies. # expressed numerically |
|
|
Define qualitative |
These are descriptive in nature |
|
|
Discrete variable |
Characteristic of an object that can take only countable values or exact fixed values . |
|
|
Continuous variable |
Variables that assume any value within an interval or take values that are not countable eg weight , age |
|
|
Nominal scale |
A variable whose possible values are categorized |
|
|
Ordinal scale |
Consists of rank order categories |
|
|
Interval scale |
Natural ordering eg temperature in °c |
|
|
Ratio scale |
Difference between meaningful successive values |
|
|
Must remember |
Frequency distribution is mostly used for quantitative data and less for qualitative data |
|
|
Adv and dis of frequency distribution |
Adv -quick visual picture Dis- identity of observations is lost and are not sure of actual values |
|
|
Define frequency |
Number of times a certain value occures |
|
|
How to construct class boundaries? |
Obtained by taking the average of the upper class limit of one class and the lower class limit of the next higher class. |
|
|
What is class width /size? |
Using class boundaries |
|
|
Define array |
Arrangement of data in order of size |
|
|
What is the class mark? |
Also known as class mid point. This is done by adding the class limit s/boundaries and dividing by 2. |
|
|
Define adjacent |
Side by side |
|
|
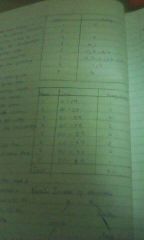
How to construct a frequency distribution / table ? |
STEP 1: identify the largest and smallest number STEP 2: calculate the range STEP 3:k=1+3.322=number of classes STEP 4: range /k= class size STEP 5: decide where to start the first class *(must contain smallest observation) |
|
|
Relative frequency |
Frequency/total frequency |
|
|
Less than cumulative frequency |
The number of observations lower than the upper class boundary * Usually starts with the first classes upper boundary |
|
|
More than cumulative frequency |
*usually starts with the first classes lower boundary |
|
|
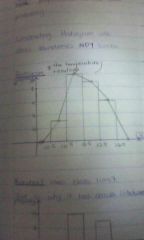
Histogram |
|
|
|
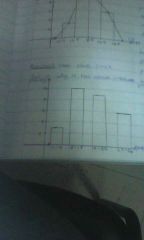
Bar chart Bar chart |
|
|
|
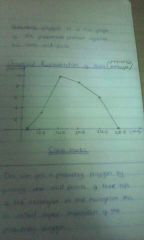
Frequency polygon( graphical representation of data) |
|
|
|
Always to remember about graphs |
Frequency is always vertical and measurements are horizontal. |
|
|
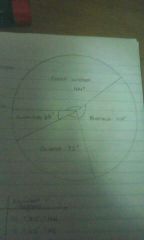
Pie chart |
|
|
|
Stem and leaf |
|
|
|
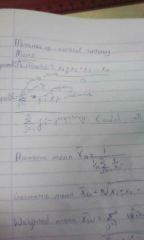
Arithmetic mean |
|
|
|
Mean:ungrouped arithmetic and grouped |
|
|
|
Harmonic , geometric, weighted mean and combined |
|
|
|
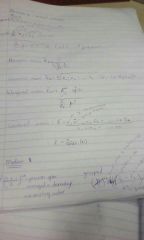
Median grouped and ungrouped |
|